
Inflation Squeeze On Wages?
Relative compression vis a vis recent past (not controlling for composition), but still up since the onset of the pandemic.
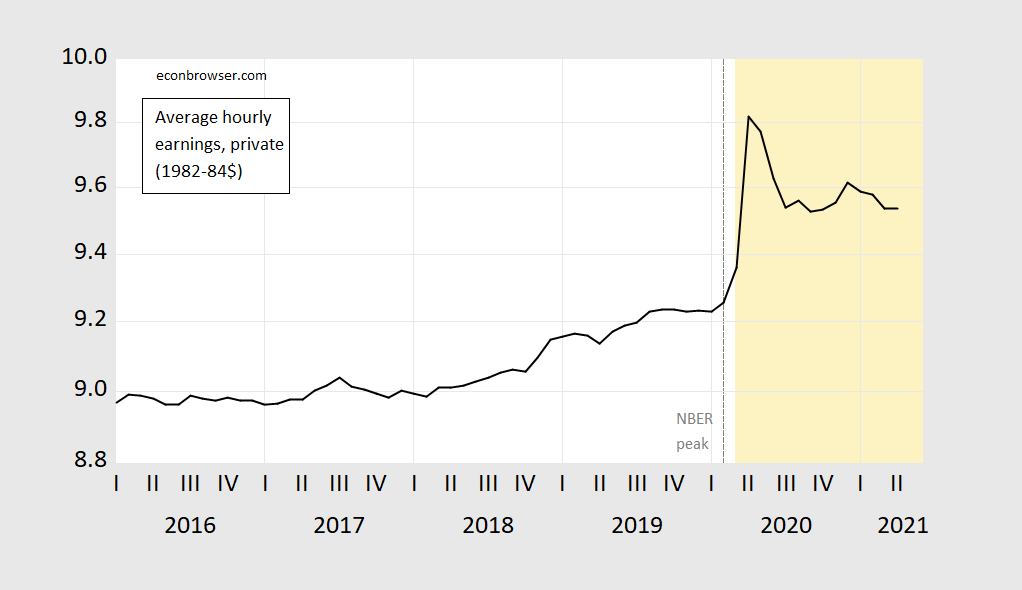
Figure 1: Average hourly earnings in private sector, deflated by CPI (blue, on log scale). NBER peak at dashed line, pandemic period shaded orange. Source: BLS via FRED, and author’s calculations.
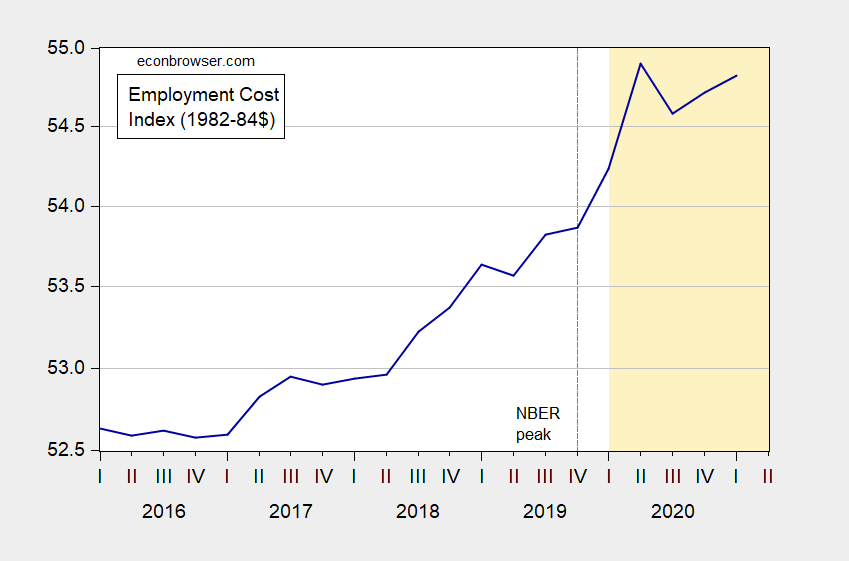
Figure 2: Employment cost index (2005=100) deflated by CPI (blue, on log scale). NBER peak at dashed line, pandemic period shaded orange. Source: BLS via FRED, and author’s calculations.
These are all averages, and will not account for compositional changes in the employment pool. Moreover, there are sectoral differences, and the number of hours (as opposed to some proxy for wages) will differ considerably over households. For one hard-hit sector (leisure and hospitality), here is the evolution of real wages.
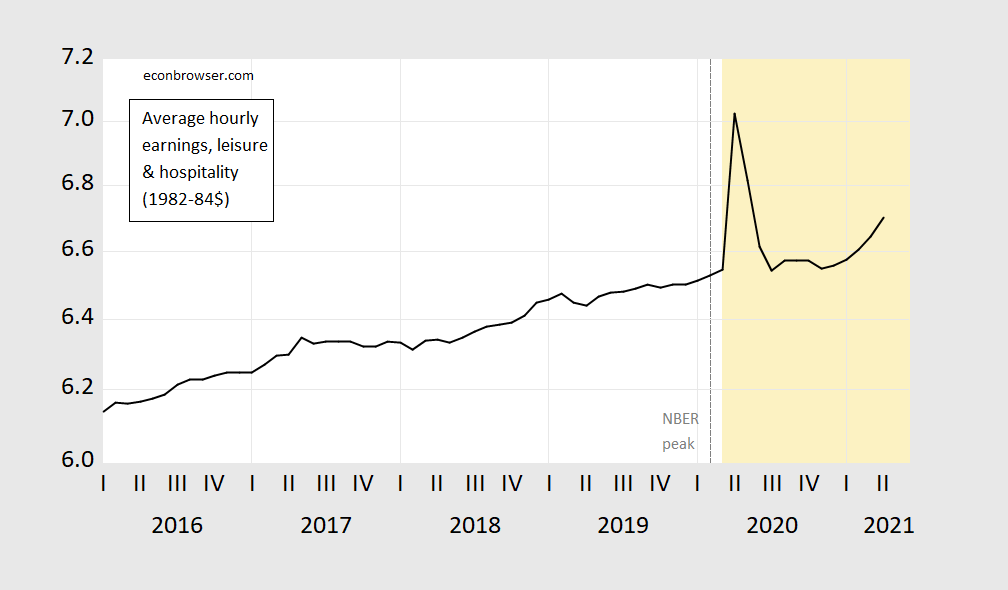
Figure 3: Average hourly earnings leisure and hospitality industry, deflated by CPI (blue, on log scale). NBER peak at dashed line, pandemic period shaded orange. Source: BLS via FRED, and author’s calculations.
Disclosure: None.


