
Exploring Alternatives To The US 60/40 Benchmark: Part I
There’s been an ongoing debate in recent years about the prospects for the US 60/40 stocks/bonds benchmark, which has become a staple for portfolio analytics. There’s much to criticize here, and arguably the weaknesses of the 60/40 standard are mounting in an increasingly global and complex world. But for good or ill, the 60/40 mix is a common reference point. The question is whether it’s time to move on? Yes, but that’s the easy answer. Next question: What portfolio benchmark should replace it?
Here’s where things get interesting – and complicated. Suffice to say, there’s a world of possibility here, starting with the major asset classes. and any number of variations — see the strategy benchmarks here, for instance.
For any given investor or institution, all the usual risk-management factors will (or at least should) influence preferences (risk tolerance, investment objective, time horizon, etc.). Meanwhile, the focus here is the pursuit of a generic alternative to the standard choice. There’s been no shortage of research on the subject in recent years. In this series, I’ll start by looking at some of the obvious possibilities and move on to various flavors of alternatives.
In this introductory post, let’s begin by setting up some standard benchmarks that move only slightly beyond the US 60/40 allocation. Think of this starting point as a baseline for perspective on the research to follow.
This review will use ETFs to build and test portfolios, starting with the primary US 60/40 benchmark, which is based on a 60% weighting in Vanguard Total US Stock Market (VTI) and 40% in Vanguard Total US Bond Market (BND), a.k.a. BMK.60.40. Year-end rebalancing applies throughout, for the US benchmark and the three alternative portfolios defined as:
BMK.60.40.Alt-1
60%: Vanguard Total World Stock Index (VT)
20%: Vanguard Total US Bond Market (BND)
20%: SPDR Bloomberg Barclays International Treasury Bond (BWX)BMK.60.40.Alt-2
60%: Vanguard Total World Stock Index (VT)
20%: Vanguard Total US Bond Market (BND)
10%: SPDR Bloomberg Barclays International Treasury Bond (BWX)
10%: VanEck Vectors J.P. Morgan EM Local Currency Bond (EMLC)BMK.60.40.Alt-3
60%: Vanguard Total World Stock Index (VT)
8%: Vanguard Total US Bond Market (BND)
8%: SPDR Bloomberg Barclays International Treasury Bond (BWX)
8%: VanEck Vectors J.P. Morgan EM Local Currency Bond (EMLC)
8%: Vanguard US Real Estate (VNQ)
8%: WisdomTree Continuous Commodity (GCC)
Systematically expanding the standard 60/40 US stock/bond mix into international markets and then adding US real estate investment trusts and commodities has merit, but the results have been disappointing in recent years. That could change, of course, and there are several reasons for entertaining that possibility.
Meantime, here’s how the three alternative portfolios compare to the US 60/40 mix, based on a start date of Dec. 31, 2010.
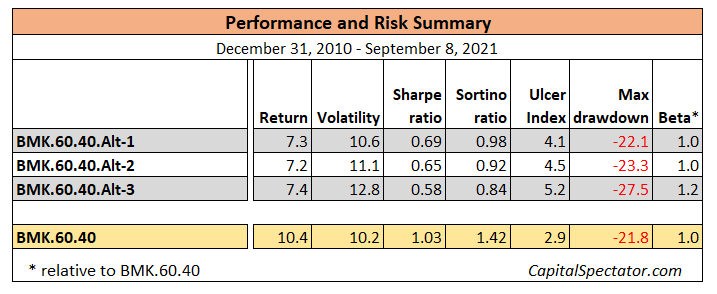

Have the results materially changed in the past five years? In a word, no.


The main takeaway from these results suggests that developing an alternative to the US 60/40 allocation isn’t going to be easy, which is to say without paying a price. In this initial test, it appears that you’ll have to pick your poison: accept substantially lower return or embrace a higher (or at least materially different) risk profile, or some combination.
In part II, I’ll push the envelope a bit more and consider another trio of alternatives that move beyond the standard choices outlined above in an effort to find a better trade-off between risk and return.
Disclosures: None.


