
Advertisement
Advertisement
EOS, Stellar’s Lumen, and Tron’s TRX – Daily Analysis – June 9th, 2021
By:
It's been a bearish morning for the majors. A move back through the early highs would be needed, however, to avoid an extended sell-off.

In this article:
EOS
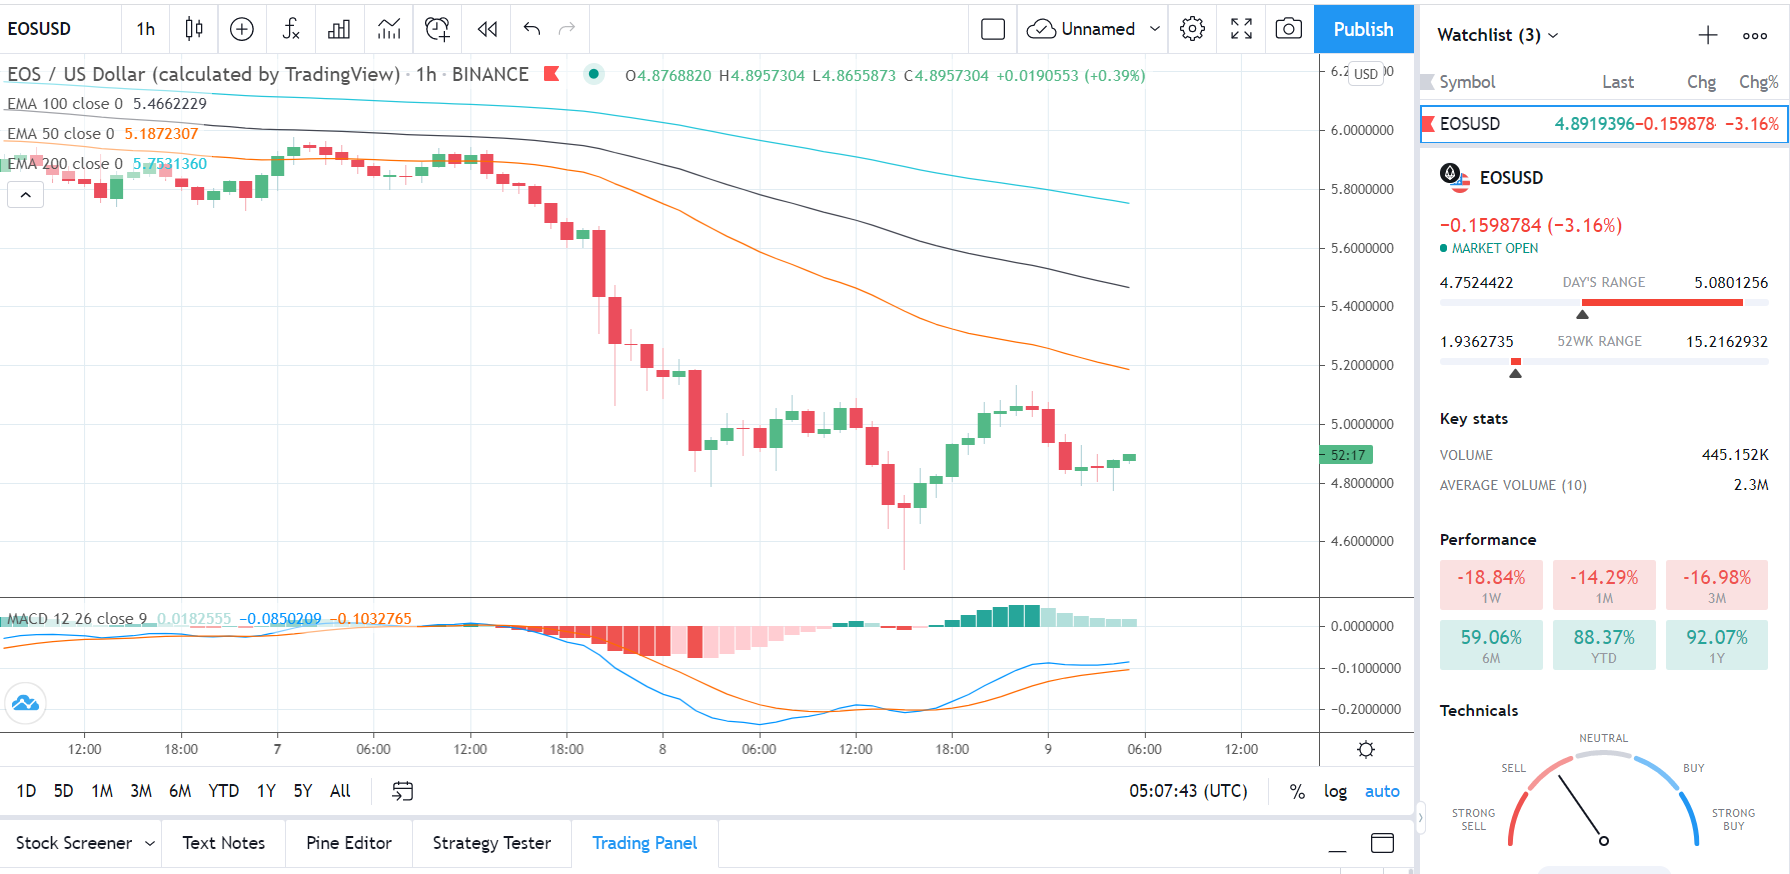
EOS fell by 2.55% on Tuesday. Following an 11.32% slide on Monday, EOS ended the day at $5.0519.
A bullish start to the day saw EOS rise to an early morning intraday high $5.2590 before hitting reverse.
Falling short of the first major resistance level at $5.7442, EOS slid to a mid-afternoon intraday low $4.5070.
The extended sell-off saw EOS fall through the first major support level at $4.8553 and the second major support level at $4.5253.
Finding late support, however, EOS broke back through the major support levels to end the day at $5.00 levels.
At the time of writing, EOS was down by 3.16% to $4.8919. A mixed start to the day saw EOS rise to an early morning high $5.0801 before falling to a low $4.7524.
EOS left the major support and resistance levels untested early on.
For the day ahead
EOS would need to move back through the $4.9393 pivot to bring the first major resistance level at $5.3716 into play.
Support from the broader market would be needed for EOS to break out from Tuesday’s high $5.2590.
Barring a broad-based crypto rally, the first major resistance level would likely cap any upside.
In the event of an extended rally, EOS could test the second major resistance level at $5.6913.
Failure to move back through the $4.9393 pivot and would bring the first major support level at $4.6196 into play.
Barring another extended sell-off, however, EOS should steer clear of the second major support level at $4.1834.
Looking at the Technical Indicators
First Major Support Level: $4.6196
First Major resistance Level: $5.3716
23.6% FIB Retracement Level: $6.52
38% FIB Retracement Level: $9.68
62% FIB Retracement Level: $14.77
Stellar’s Lumen
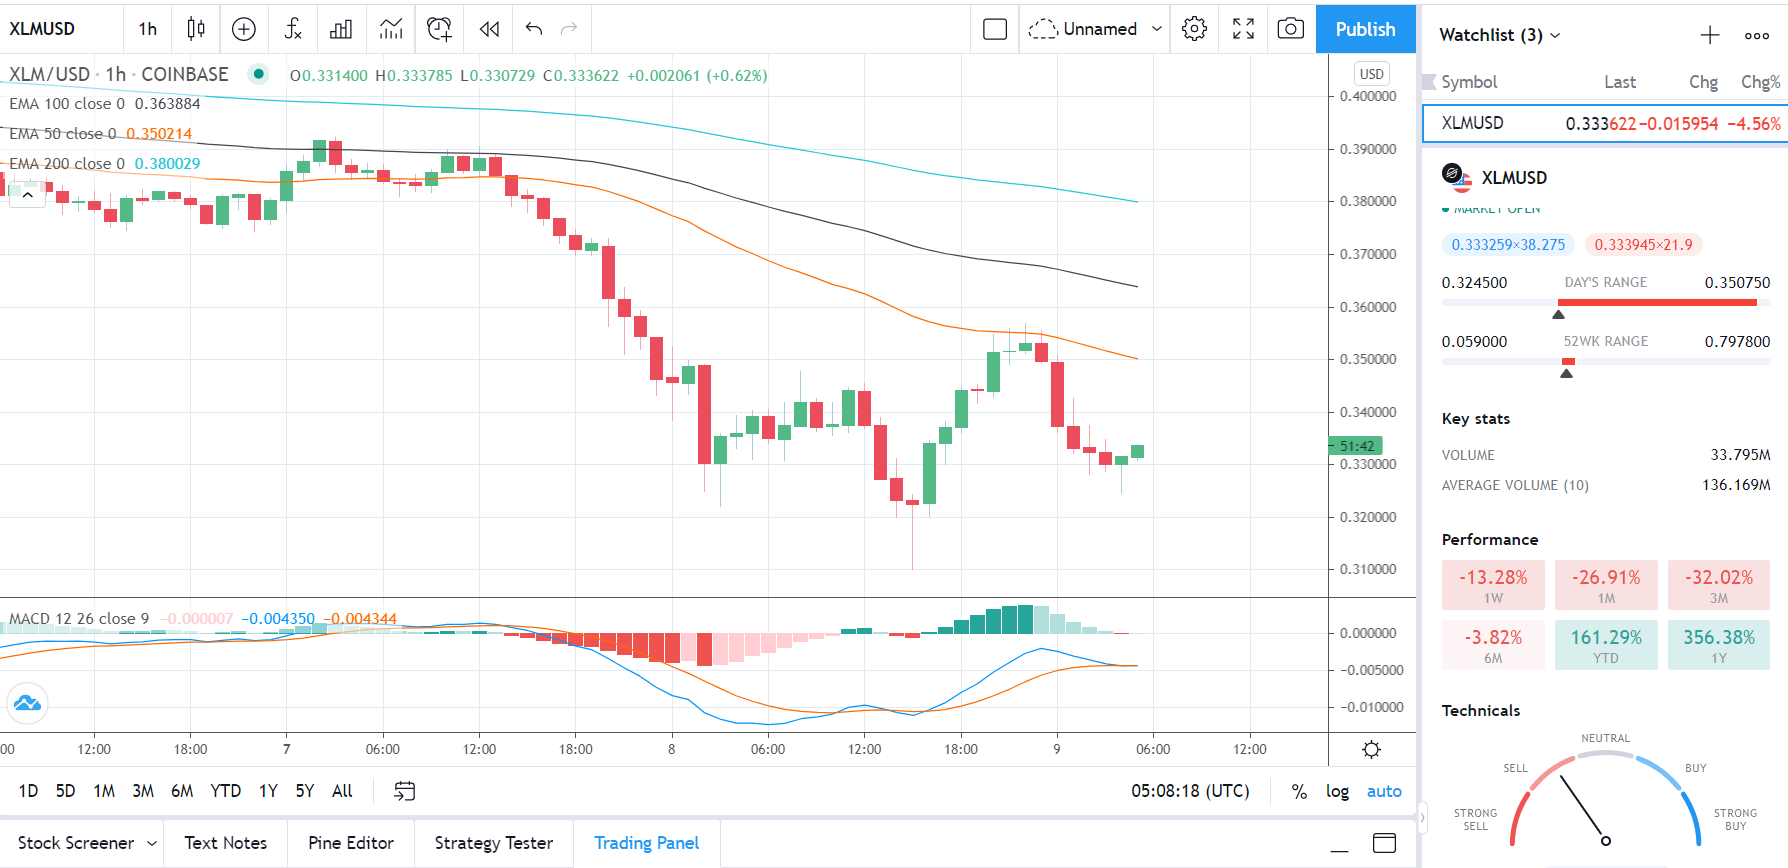
Stellar’s Lumen rose by 0.89% on Tuesday. Following an 8.99% slide on Monday, Stellar’s Lumen ended the day at $0.3496.
After a choppy start to the day, Stellar’s Lumen fell to a mid-afternoon intraday low $0.3102 before finding support.
Stellar’s Lumen fell through the first major support level at $0.3288 and the second major support level at $0.3113.
The extended sell-off also saw Stellar’s Lumen fall through the 62% FIB of $0.3216.
Finding late support, however, Stellar’s Lumen broke back through the 62% FIB and the major support levels to end the day at $0.34 levels.
At the time of writing, Stellar’s Lumen was down by 4.56% to $0.3336. A mixed start to the day saw Stellar’s Lumen rise to an early morning high $0.3508 before falling to a low $0.3245.
Stellar’s Lumen left the major support and resistance levels untested early on.
For the day ahead
Stellar’s Lumen would need to move back through the $0.3389 pivot to bring the first major resistance level at $0.3675 into play.
Support from the broader market would be needed, however, for Stellar’s Lumen to break out from Tuesday’s high $0.3568.
Barring an extended rally, the first major resistance level would likely cap any upside.
In the event of a broad-based crypto rally, Stellar’s Lumen could test resistance at $0.38 before any pullback. The second major resistance level sits at $0.3855.
Failure to move back through the $0.3389 pivot would bring the 62% FIB of $0.3216 and the first major support level at $0.3209 back into play.
Barring another extended sell-off on the day, Stellar’s Lumen should steer clear of sub-$0.30 levels. The second major support level sits at $0.2923.
A sustained fall through the 62% FIB of $0.3216 would form a near-term bearish trend from 16th May’s swing hi $0.7978.
Looking at the Technical Indicators
First Major Support Level: $0.3209
First Major Resistance Level: $0.3675
23.6% FIB Retracement Level: $0.6160
38% FIB Retracement Level: $0.5035
62% FIB Retracement Level: $0.3216
Tron’s TRX
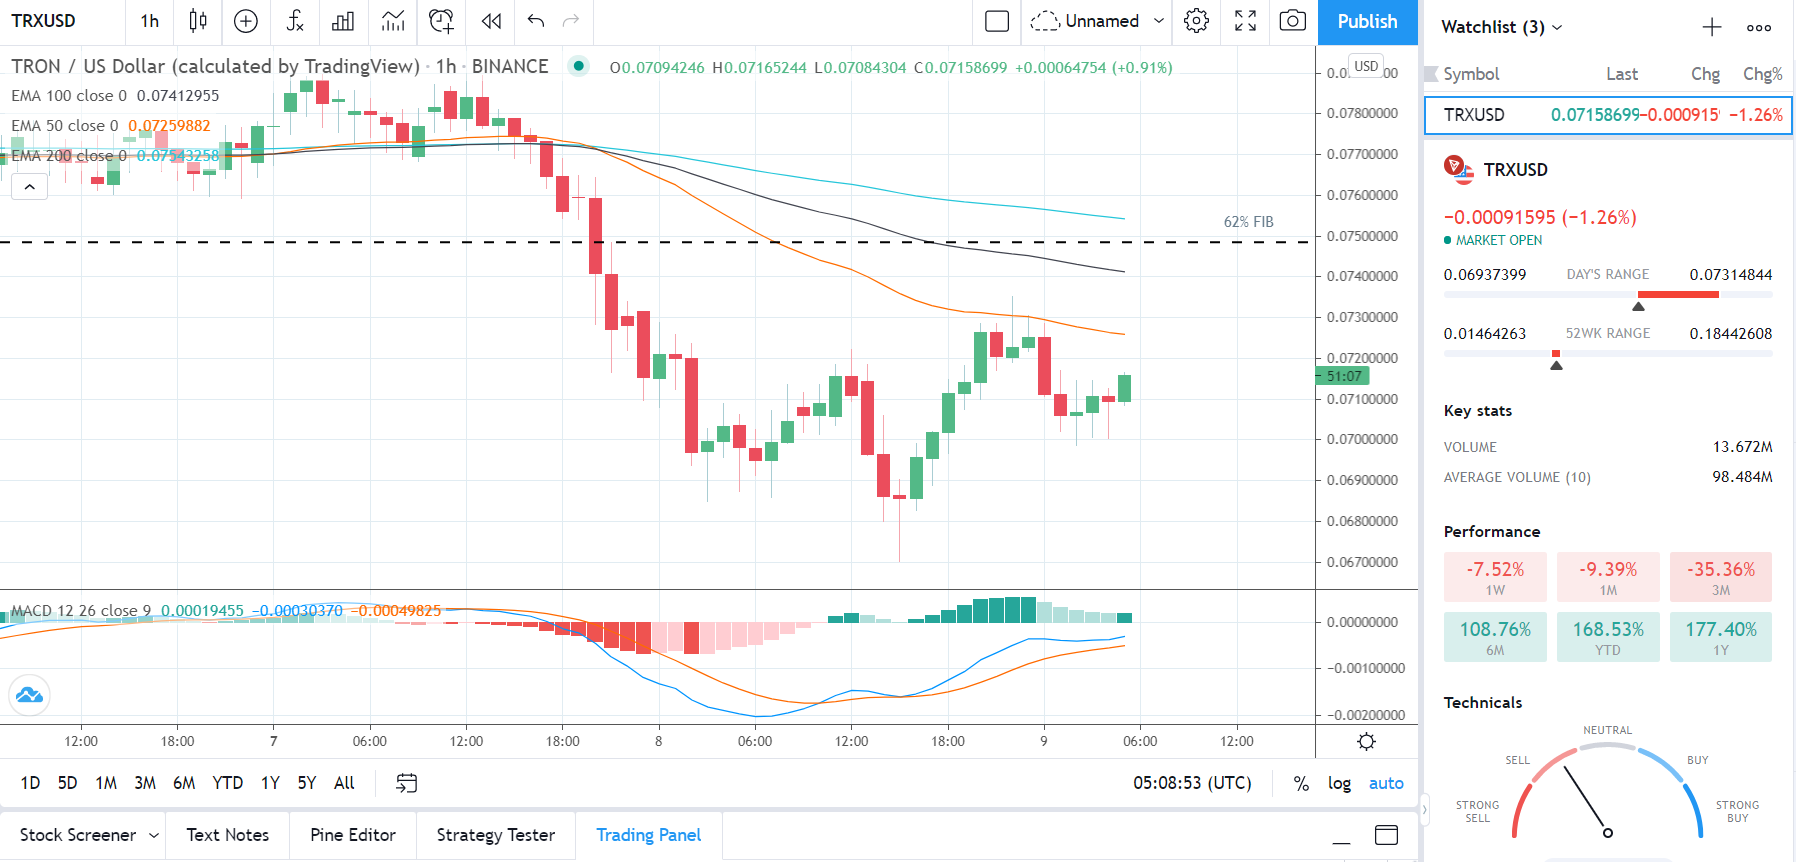
Tron’s TRX rose by 1.37% on Tuesday. Partially reversing a 7.93% slide from Monday, Tron’s TRX ended the day at $0.07250.
After a mixed start to the day, Tron’s TRX fell to a mid-afternoon intraday low $0.06703 before making a move.
Tron’s TRX fell through the first major support level at $0.06868 before rising to a late intraday high $0.07351.
Falling short of the 62% FIB of $0.07480 and the first major resistance level at $0.07668, Tron’s TRX eased back to end the day at sub-$0.073 levels.
At the time of writing, Tron’s TRX was down by 1.26% to $0.07159. A choppy start to the day saw Tron’s TRX rise to an early morning high $0.07315 before falling to a low $0.06937.
Tron’s TRX left the major support and resistance levels untested early on.
For the Day Ahead
Tron’s TRX would need to avoid a fall back through $0.07101 pivot to bring the 62% FIB of $0.07480 and the first major resistance level at $0.07500 into play.
Support from the broader market would be needed, however, for Tron’s TRX to break out from Tuesday’s high $0.07351.
Barring an extended crypto rally, the 62% FIB of $0.07480 and the first major resistance level would likely cap any upside.
In the event of a broad-based crypto rally, Tron’s TRX could test resistance at $0.078 before any pullback. The second major resistance level sits at $0.07749.
A fall back through the $0.07101 pivot would bring the first major support level at $0.06852 into play.
Barring another extended sell-off, however, Tron’s TRX should steer clear of sub-$0.065 levels. The second major support level sits at $0.06453.
A sustained fall back through the 62% FIB of $0.0748 would form a near-term bearish trend from April’s swing hi $0.1844.
Looking at the Technical Indicators
First Major Support Level: $0.06852
First Major Resistance Level: $0.07500
23.6% FIB Retracement Level: $0.1426
38.2% FIB Retracement Level: $0.1167
62% FIB Retracement Level: $0.0748
Please let us know what you think in the comments below
Thanks, Bob
About the Author
Bob Masonauthor
With over 20 years of experience in the finance industry, Bob has been managing regional teams across Europe and Asia and focusing on analytics across both corporate and financial institutions. Currently he is covering developments relating to the financial markets, including currencies, commodities, alternative asset classes, and global equities.
Did you find this article useful?
Latest news and analysis


Advertisement