Join Our Telegram channel to stay up to date on breaking news coverage
Bitcoin Price Prediction – June 13
The Bitcoin price touches the major resistance level at $37,490 instead of just battling with supports.
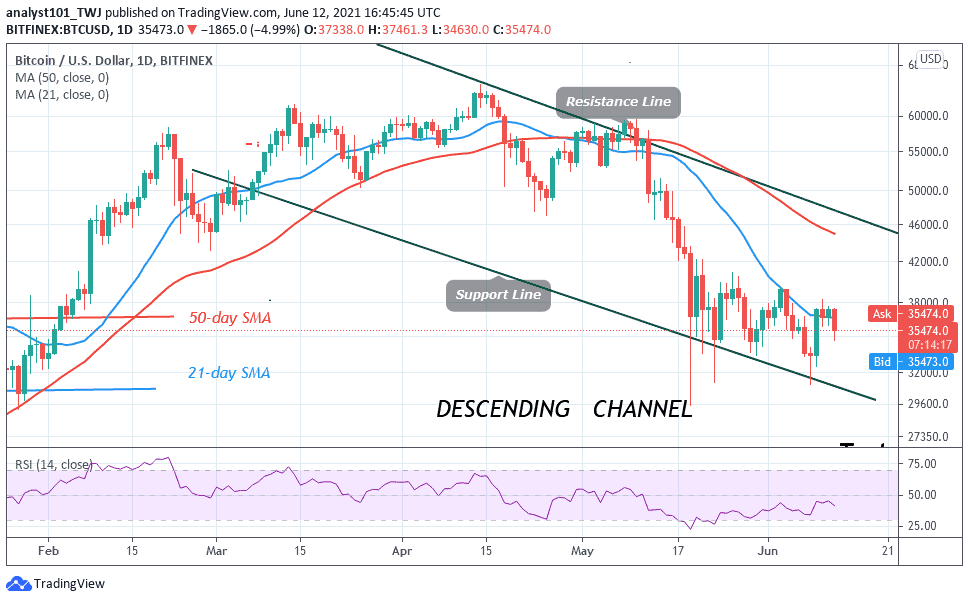
BTC/USD Long-term Trend: Bearish (Daily Chart)
Key levels:
Resistance Levels: $43,000, $45,000, $47,000
Support Levels: $30,000, $28,000, $26,000
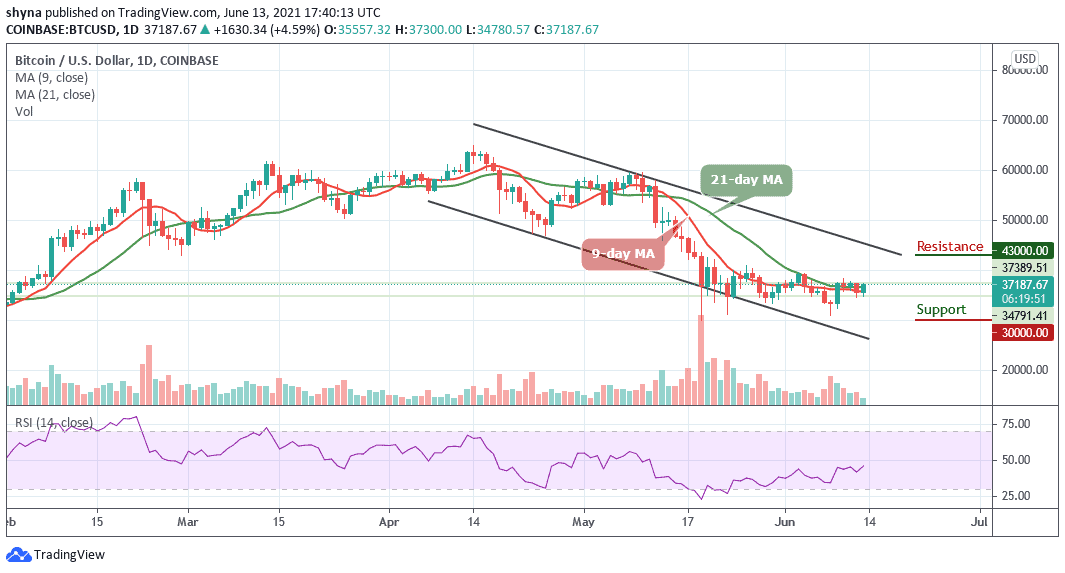
BTC/USD is currently pushing the price above the nearest resistance level. The coin is moving above $37,000 to trade at $37,390 at the time of writing. More so, the Bitcoin price has gained over 5% since the European session as it is using $34,780 support as a jumping-off ground to develop the upside momentum, which is now gaining traction.
Bitcoin Price Prediction: What Could Be the Next Move?
The return above $37,000 could set the framework for gains towards $40,000. Meanwhile, the technical indicator shows that the bulls are ready for action especially when the up-trending Relative Strength Index (14) is considered. Any further bullish movement above the 9-day and 21-day moving averages could pave the way for gains above $38,500. Other resistance levels are located at $43,000, $45,000, and $47,000.
Looking at the downside, if the Bitcoin price falls back below the $35,000 level and move to cross below the moving averages, the bears may wrestle out the control over the situation very quickly and the next important support may come at $33,000, which could be followed by $30,000, $28,000, and $26,000 support levels.
BTC/USD Medium – Term Trend: Bullish (4H Chart)
Looking at the 4-hour chart, the Bitcoin price is currently trading around $38,796 above the 9-day and 21-day moving averages after a reversal from $34,840. Meanwhile, the 4-hour chart shows that the bullish supply is coming up in the market while the bears are also trying to bring the price down.
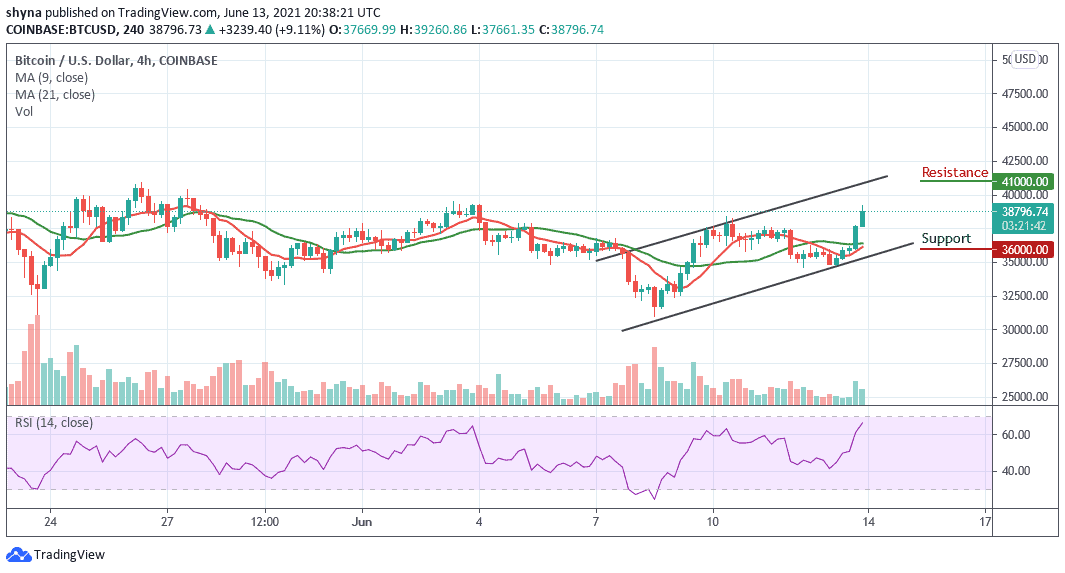
Furthermore, if the buyers could strengthen and energize the market more, they can further push the price to a $40,000 resistance level. Therefore, breaking the mentioned resistance may likely allow the bulls to test the $41,000 and above. In other words, the Relative Strength Index (14) is currently moving towards the overbought region, but when it turns down; the bears could step back into the market and bring the price to the support level of $36,000 and below.
Looking to buy or trade Bitcoin (BTC) now? Invest at eToro!
75% of retail investor accounts lose money when trading CFDs with this provider
Join Our Telegram channel to stay up to date on breaking news coverage