Join Our Telegram channel to stay up to date on breaking news coverage
Litecoin Price Prediction – June 14
Litecoin (LTC) will soon see a significant short-term rally or the cryptocurrency could see a worrying decline towards the $165 support level.
LTC/USD Market
Key Levels:
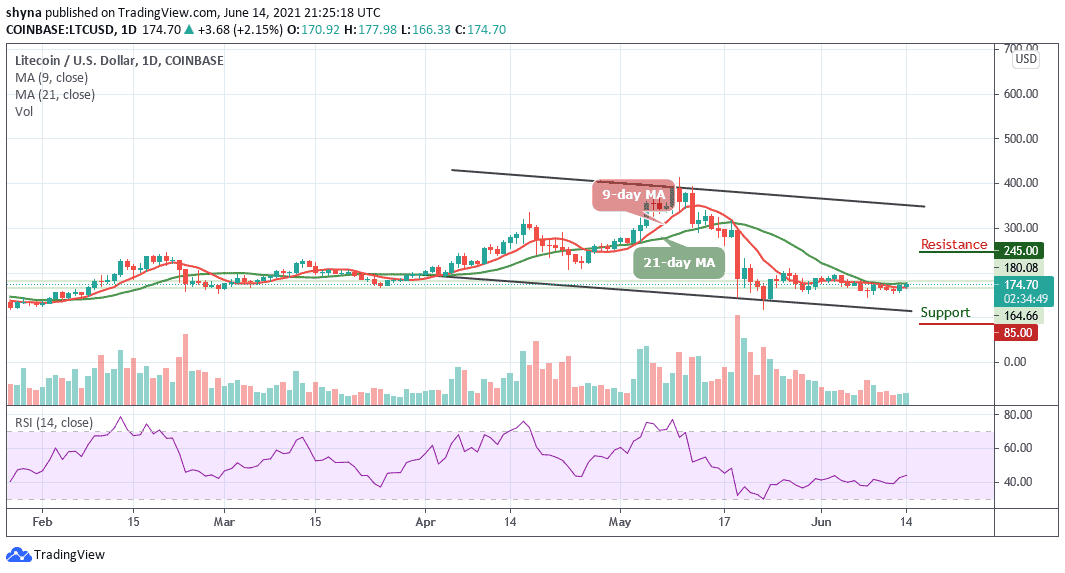
Resistance levels: $245, $265, $285
Support levels: $85, $65, $45
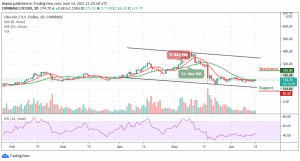
LTC/USD is still stuck in an incredibly tight trading range after missing a bullish rally. An early day rally towards the $180 level failed to generate sustainable gains, with the Litecoin price slipping back under the daily high of $177 resistance level. Meanwhile, the longer that the crypto fails to rally from the current trading level; the greater the chance that we may see it falling touching a new month trading low.
Litecoin Price Prediction: Ready to Challenge the $180 Level?
As the daily chart reveals, the Litecoin price is hovering within the 9-day and 21-day moving averages and a break below the lower boundary of the channel may provoke an even deeper decline towards the $85, $65, and $45 support levels. Therefore, the short-term technical analysis shows that the $160 and $150 levels remain the strongest forms of technical support before the $140 level starts to come back into focus.
In other words, the daily chart highlights that the $180 level is a key technical region in which bulls need to break. Further bullish movement could reach the resistance levels at $245, $265, and $285. However, the technical indicator Relative Strength Index (14) is currently moving towards 45-level which may likely cause the market to resume the uptrends.
When compares with Bitcoin, Litecoin (LTC) has evolved for a while in a very different way. But currently, sellers are controlling the market as the Litecoin price moves below the 9-day and 21-day moving averages around the lower boundary of the channel. Therefore, the technical indicator Relative Strength Index (14) remains below 40-level which may keep the bearish signals into the market.
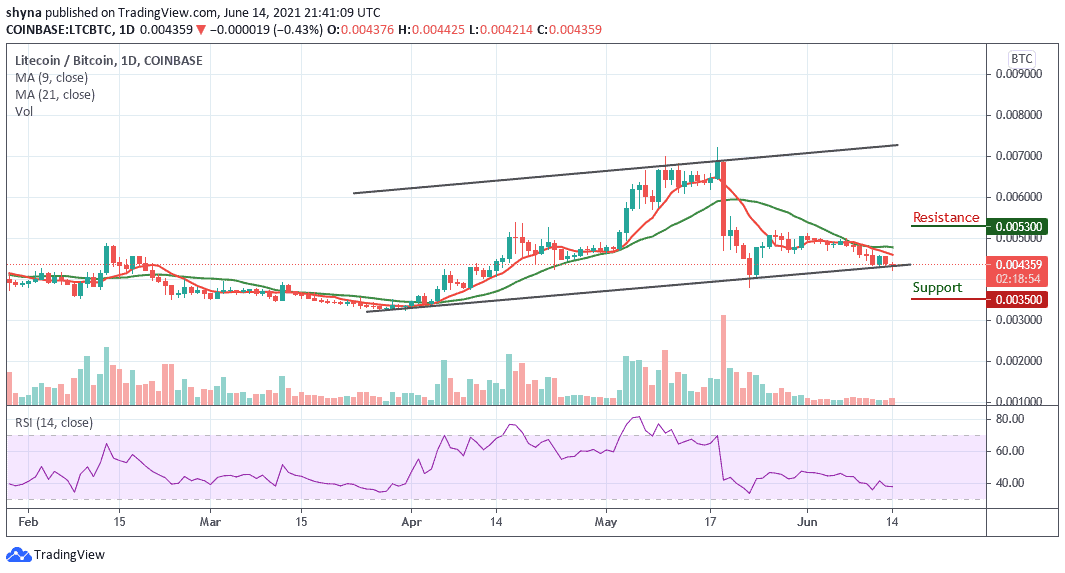
However, the technical indicator gives sellers the confidence to increase their entries. In fact, if the bears manage to break the price, the market would be expected to fall to the support level of 3500 SAT and below. Meanwhile, a bounce could take them to 5300 SAT and 5500 SAT.
Looking to buy or trade Litecoin (LTC) now? Invest at eToro!
75% of retail investor accounts lose money when trading CFDs with this provider
Join Our Telegram channel to stay up to date on breaking news coverage