
US Dollar Price Action Setups Pre-FOMC: GBP/USD, USD/CAD, EUR/USD
So we’re finally here, fast approaching an FOMC rate decision in which we might get some new information. The Fed has been in a holding pattern of recent, hopeful that growth trends continue to show despite some of the continued lag that’s shown in the labor market. The bank has continually said that they feel that inflation is transitory; many other market participants have disagreed in varying ways, instead of expecting that the massive stimulus employed over the past 15 months would, eventually, lead to rampant price increases.
Tomorrow is big because it’s a quarterly meeting and the Fed will be providing updated forecasts and projections. The last one of these that we received was in March before inflation had begun to really run higher in any significant way and there’s the chance that the Fed is perhaps a bit less dovish in tomorrow’s outlay.
Now, with that being said and judging by movements in rates markets, it seems that there’s little expectation for any tapering announcements or significantly faster rate hikes. The 10-year note pushed back down to 1.45% last week on the heels of that CPI release and so far this week, has remained below 1.52%; the latter of which constitutes a three-month low for the 10-year.
In the US Dollar, there’s been a mild bounce that’s held since last Friday but this appears to be driven by positioning ahead of the event. The USD did technically touch a fresh monthly high but this is also around the same resistance that came into play just a couple of weeks ago.
US DOLLAR FOUR-HOUR PRICE CHART
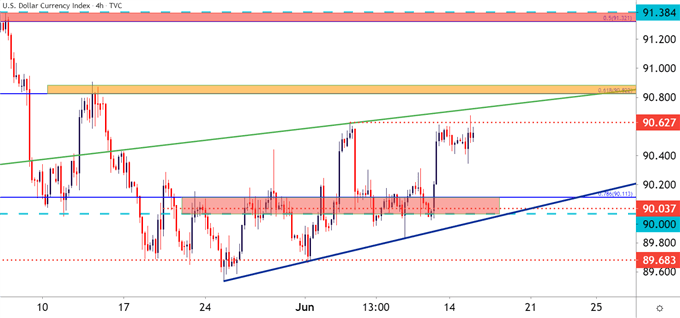
Chart prepared by James Stanley; USD, DXY on Tradingview
US DOLLAR BIGGER-PICTURE: SUPPORT STILL IN PLACE
Taking a step back on the USD chart and, likely a reason for this continued range-like behavior, is a big zone of long-term support that’s stubbornly remained in place so far this year, even despite a persistent approach from USD bears.
This zone comes in around the 90-handle on DXY, a psychological level, but there’s also a Fibonacci level lurking just underneath around 89.92. Collectively, these prices set up a zone of confluence that bears haven’t yet been able to take-out. This is the same area of prices that came into play early in the year to quell the downtrend before the Q1 rally took hold. And the zone came back into play after the first seven weeks of Q2 trade saw sellers re-take control of the matter.
The bigger question here is: What might happen that could allow for the USD to finally leave this area behind? Likely, the matter would need some assistance from the Euro or perhaps even the Japanese Yen.
US DOLLAR MONTHLY CHART
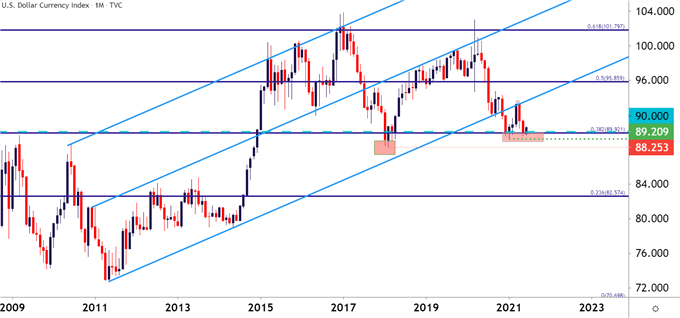
Chart prepared by James Stanley; USD, DXY on Tradingview
EUR/USD: LOWER-LOW, POSSIBLE LOWER-HIGH
That flare of USD-strength late last week also came with an interesting push in EUR/USD as the pair moved down to a fresh multi-week low. And so far this week, the bounce from that new low has found resistance at a prior support area, around 1.2134 which is a Fibonacci level making up the 2134-2167 zone.
That support zone held the lows through mid-May through early June, but now it appears that it’s being re-purposed as support and this can keep the door open for a deeper push down towards the 1.2033-1.2052 area of prior resistance-turned-support.
EUR/USD FOUR-HOUR PRICE CHART
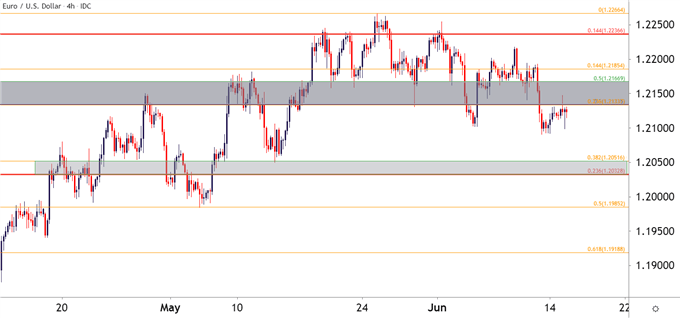
Chart prepared by James Stanley; EURUSD on Tradingview
GBP/USD REACHES DOWN FOR FIBO SUPPORT
One pair that main retain some attraction for short-side USD scenarios is GBP/USD. As looked at last week, Cable had held support a bit better than EUR/USD which made GBP/USD as a slightly more attractive alternative for bearish US Dollar approaches.
Well GBP/USD slipped down to a fresh monthly low this morning, but the pair soon found some support from a familiar Fibonacci level plotted around 1.4039. This can keep the door open for short-term reversal themes in the pair, particularly for those looking to pick on the short side of the USD.
GBP/USD FOUR-HOUR PRICE CHART
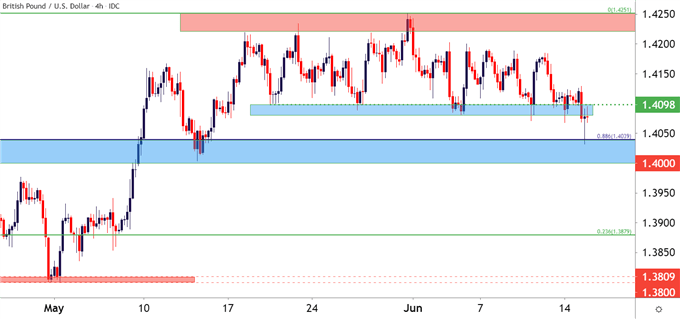
Chart prepared by James Stanley; GBPUSD on Tradingview
USD/CAD HITS ‘R2’ AS BULLS MAKE FORWARD PUSH
I’ve been following this one fairly closely. A few weeks ago USD/CAD remained in the hardened bearish trend and the 1.2000 level was coming into sight. As I had written, this could prove a tough spot to crack and, so far, it has. The lower-low printed at 1.2002 and since then, buyers have been pushing higher. I updated the setup last week and this remains a bullish USD setup ahead of tomorrow’s FOMC rate decision.
USD/CAD FOUR-HOUR PRICE CHART
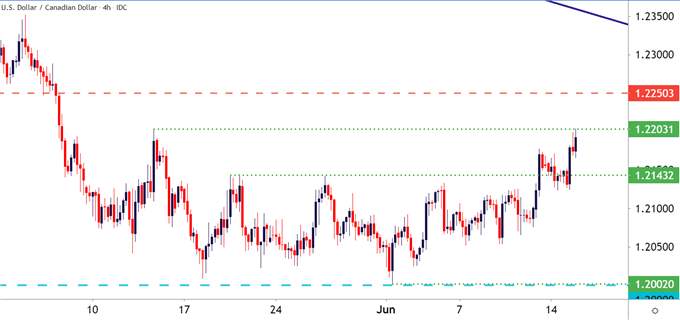
Chart prepared by James Stanley; USDCAD on Tradingview
Disclaimer: See the full disclosure for DailyFX here.


