
Oil Price Rally Eyes 2018 High As RSI Pushes Into Overbought Territory
The bullish price action in oil looks poised to persist as it extends the series of higher highs and lows carried over from the previous week, and the price of oil may approach the 2018 high ($76.90) as fresh data prints coming out of the US instill an improved outlook for consumption.
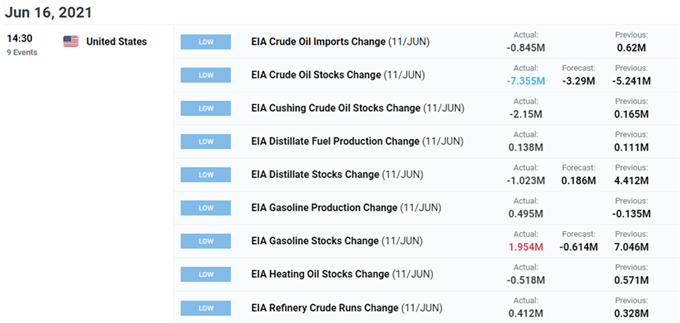
Fresh figures from the Energy Information Administration (EIA) showed crude inventories contracting for the fourth consecutive week, with US stockpiles tumbling 7.355M in the week ending June 11 following the 5.241M decline the week prior. Signs of stronger demand may keep the Organization of the Petroleum Exporting Countries (OPEC) on track to gradually restore production over the coming months as the most recent Monthly Oil Market Report (MOMR)reveals that “for 2021, world oil demand growth is kept unchanged at 6.0 mb/d,” but a further recovery in US output may become a concern for the group as production approaches pre-pandemic levels.
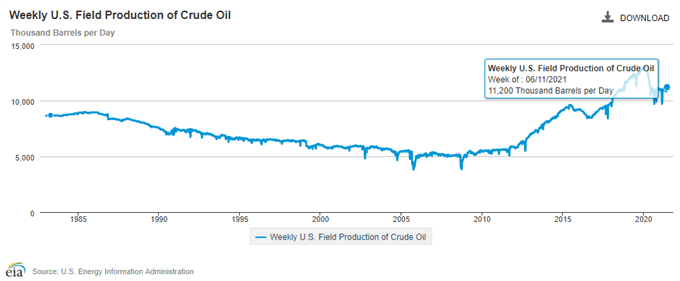
A deeper look at the EIA report showed weekly field production climbing to 11,200K from 11,000K during the same period to mark the highest reading since May 2020, and it remains to be seen if OPEC and its allies will lay out an updated production adjustment table at the next Joint Ministerial Monitoring Committee (JMMC) meeting on July 1 amid the mixed data prints coming out of the US.
Until then, the price of oil may continue to exhibit the bullish trend from earlier this year as it trades to fresh yearly highs in June, and the overbought reading in the Relative Strength Index (RSI) may continue to be accompanied by higher crude prices like the behavior seen earlier this year.
OIL PRICE DAILY CHART
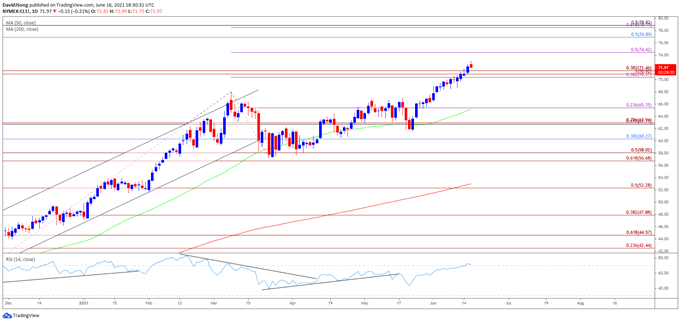
Source: Trading View
- Keep in mind, crude broke out of the range-bound price action from the third quarter of 2020 as it established an upward trending channel, with the price of oil taking out the 2019 high ($66.60) as both the 50-Day SMA ($64.26) and 200-Day SMA ($52.24)established a positive slope.
- The price of oil may continue to exhibit a bullish trend as the recent rally removes the threat of a double-top formation, and crude appears to be on track to test the 2018 high ($76.90) as it trades to fresh yearly highs in June.
- The break/close above the Fibonacci overlap around $70.40 (38.2% expansion) to $71.50 (38.2% expansion) opens up the $74.40 (50% expansion) region, with the next area of interest coming in around $76.90 (50% retracement), which coincides with the 2018 high ($76.90).
- Will keep close eye on the Relative Strength Index (RSI) as it pushes above 70, with the overbought reading likely to be accompanied by higher oil prices like the behavior seen in February.
Disclosure: See the full disclosure for DailyFX here.


