
Advertisement
Advertisement
EUR/USD Mid-Session Technical Analysis for June 18, 2021
By:
The direction of the EUR/USD on Friday is likely to be determined by trader reaction to 1.1907.
In this article:
The Euro is trading flat against the U.S. Dollar on Friday as investors adjust positions ahead of the weekend, following a steep decline the last two sessions. The single-currency is headed for its worst week in several months, pressured by the Federal Reserve’s hawkish shift in tone.
At 12:16 GMT, the EUR/USD is trading 1.1896, down 0.0011 or -0.09%.
With investors pricing in a sooner-than-expected tapering of extraordinary Federal Reserve monetary stimulus, the dovish European Central Bank (ECB) seems to be far behind in the monetary policy cycle, making the U.S. Dollar a more attractive currency.
Daily Swing Chart Technical Analysis
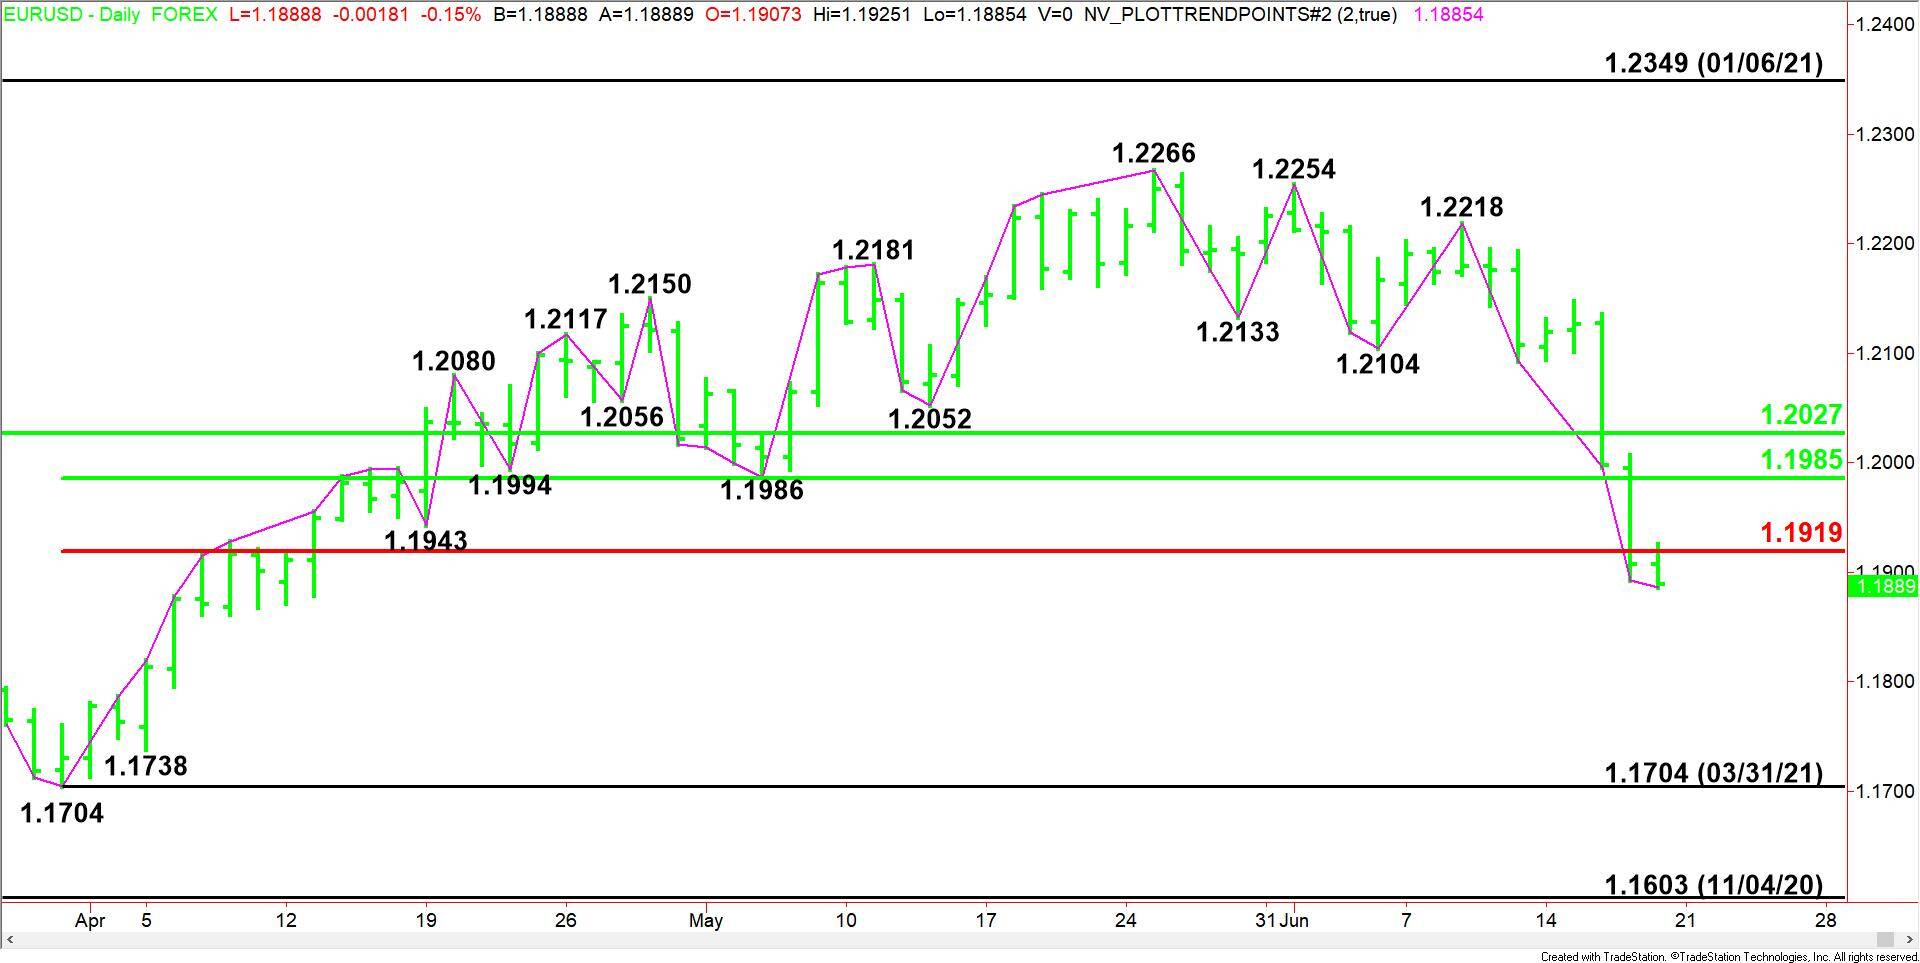
The main trend is down according to the daily swing chart. The trade through yesterday’s low at 1.1892 signals a resumption of the selling pressure.
A move through 1.2218 will change the main trend to up. This is highly unlikely, but since the EUR/USD is down seven sessions since its last main top, it is inside the window of time for a closing price reversal bottom. This chart pattern won’t change the trend, but if confirmed, it could lead to the start of a 2 to 3 day counter-trend rally.
The main range is 1.1704 to 1.2266. The EUR/USD is currently trading on the weak side of its retracement zone at 1.1919 to 1.1985, making it resistance. Additional resistance is the 50% level at 1.2027.
Daily Swing Chart Technical Forecast
The direction of the EUR/USD on Friday is likely to be determined by trader reaction to 1.1907.
Bearish Scenario
A sustained move under 1.1907 will indicate the presence of sellers. The daily chart indicates this could trigger an acceleration to the downside with the March 31 main bottom at 1.1704 the next major downside target.
Bullish Scenario
A sustained move over 1.1907 will signal the presence of buyers. Overcoming the Fibonacci level at 1.1919 will indicate the buying is getting stronger. If this move creates enough upside momentum then look for the rally to possibly extend into the 50% level at 1.1985. Since the main trend is down, look for sellers on the first test of this level.
For a look at all of today’s economic events, check out our economic calendar.
About the Author
James Hyerczykauthor
James is a Florida-based technical analyst, market researcher, educator and trader with 35+ years of experience. He is an expert in the area of patterns, price and time analysis as it applies to futures, Forex, and stocks.
Did you find this article useful?
Latest news and analysis


Advertisement