
Thoughts About Gold Recent Sell-Off
We expected a gold sell-off from the $1,920s, but the price drop from $1,900 to $1,760 in just six days sent the gold market into a panic. Although the technical and fundamental outlook for the gold market has not changed, the recent price drop appears to be a bear trap. Once the gold panic is over, prices appear to have established a bottom. This type of sell-off is very common in the months of June and July. The area between $1,765 and $1,680 has been discussed as a major inflection point for the recent bull market. Gold is on track to rise in 2021 as long as the inflection point holds. This article will concentrate on a few technical and fundamental factors that may influence gold prices in 2021.

Image Source: Pixabay
Reviewing the Gold Market's Recent Decline
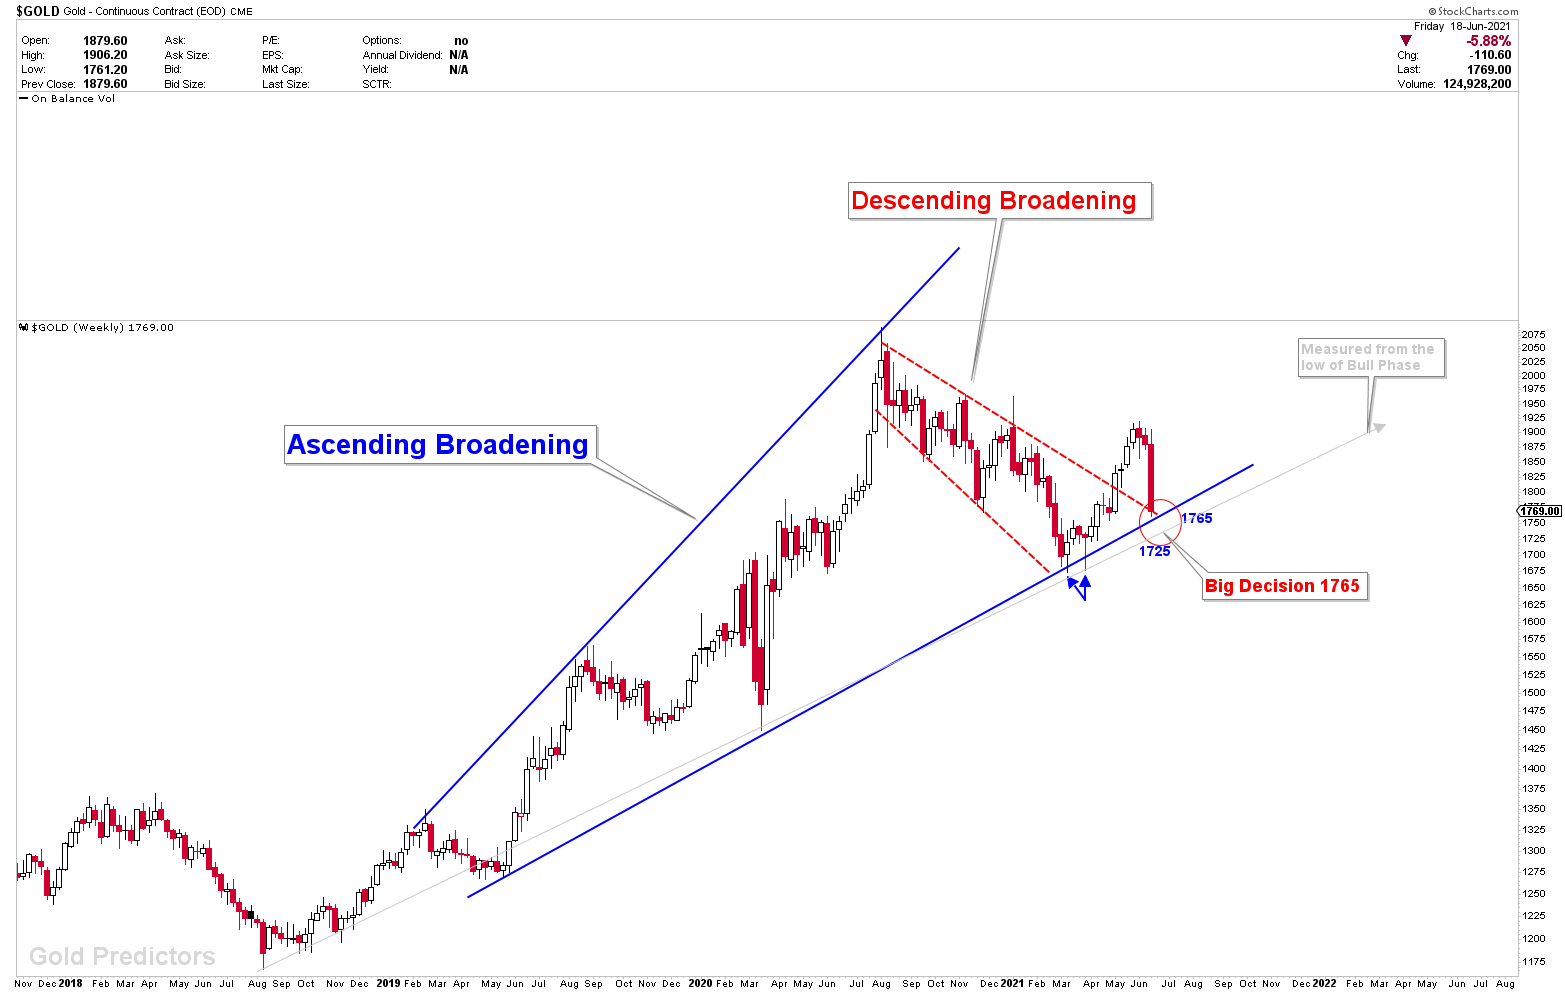
This ascending broadening structure was created for the first time in November 2020. The structure was also shared sometimes on Twitter. In the final months of 2020, we discussed with members the possibility that the gold market would experience a maximum pullback to the $1,700 region, with the lower angle of support holding at $1,680-$1,725. The gold market fell from $2,000 to $1,680, where it found support. With the help of our chart mining team, we computed the yearly inflection points in March 2021. The yearly inflection points were $1,675-$1,680, with a diverged cycle low expected on March 10th. The gold market reached its bottom on March 9th at $1,674 and then rallied to $1,900 highs. Prices were smashed again in June after the FOMC meeting, with a $140 drop-in 6 days. However, this drop has not changed the technical outlook at the moment. However, prices are approaching the final time and area, and if this area gives way, the gold market will suffer technical damage. This inflection point's long-term range is $1,765 to $1,680, and a break will cause the market to shift.
(Click on image to enlarge)
Short-Term Gold Cycles
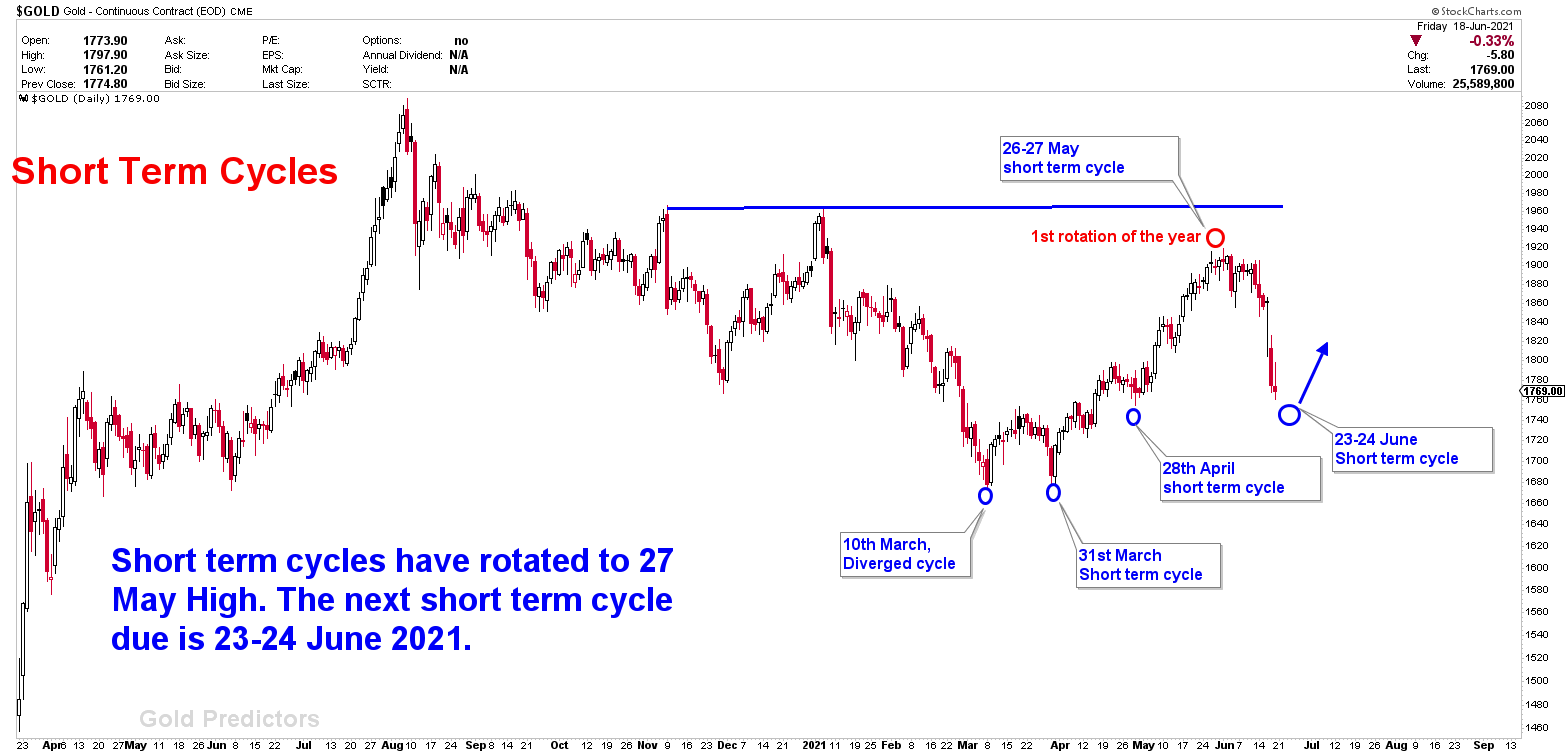
The current short-term gold cycles have been showing 90% accuracy from the moment the bottom was formed on the gold diverged cycle on March 10th. The previous cycles have changed a lot due to which prices of gold have fallen greatly. It is expected that the next bottom in short-term gold cycles will appear on 23 or 24 June 2021. It could be a seasonal bottom which means that lows will be attained through large swings. Note: Because of large uncertainty, it is best to allow a 48-hours deviation.
Keep in mind that a pullback in the months of June or July can be very good for a powerful rally during the months of September or October due to gold seasonal tendencies. This new rally will lead to a huge pullback in October or November, and then it will have a good ending at the end of the year 2021. The inflection points that we have mentioned in this report can breach if gold does not stay in the bull market. If this happens, then gold prices will decline sharply, which will create an unfavorable situation for many people.
(Click on image to enlarge)
The panic state due to drop in gold prices
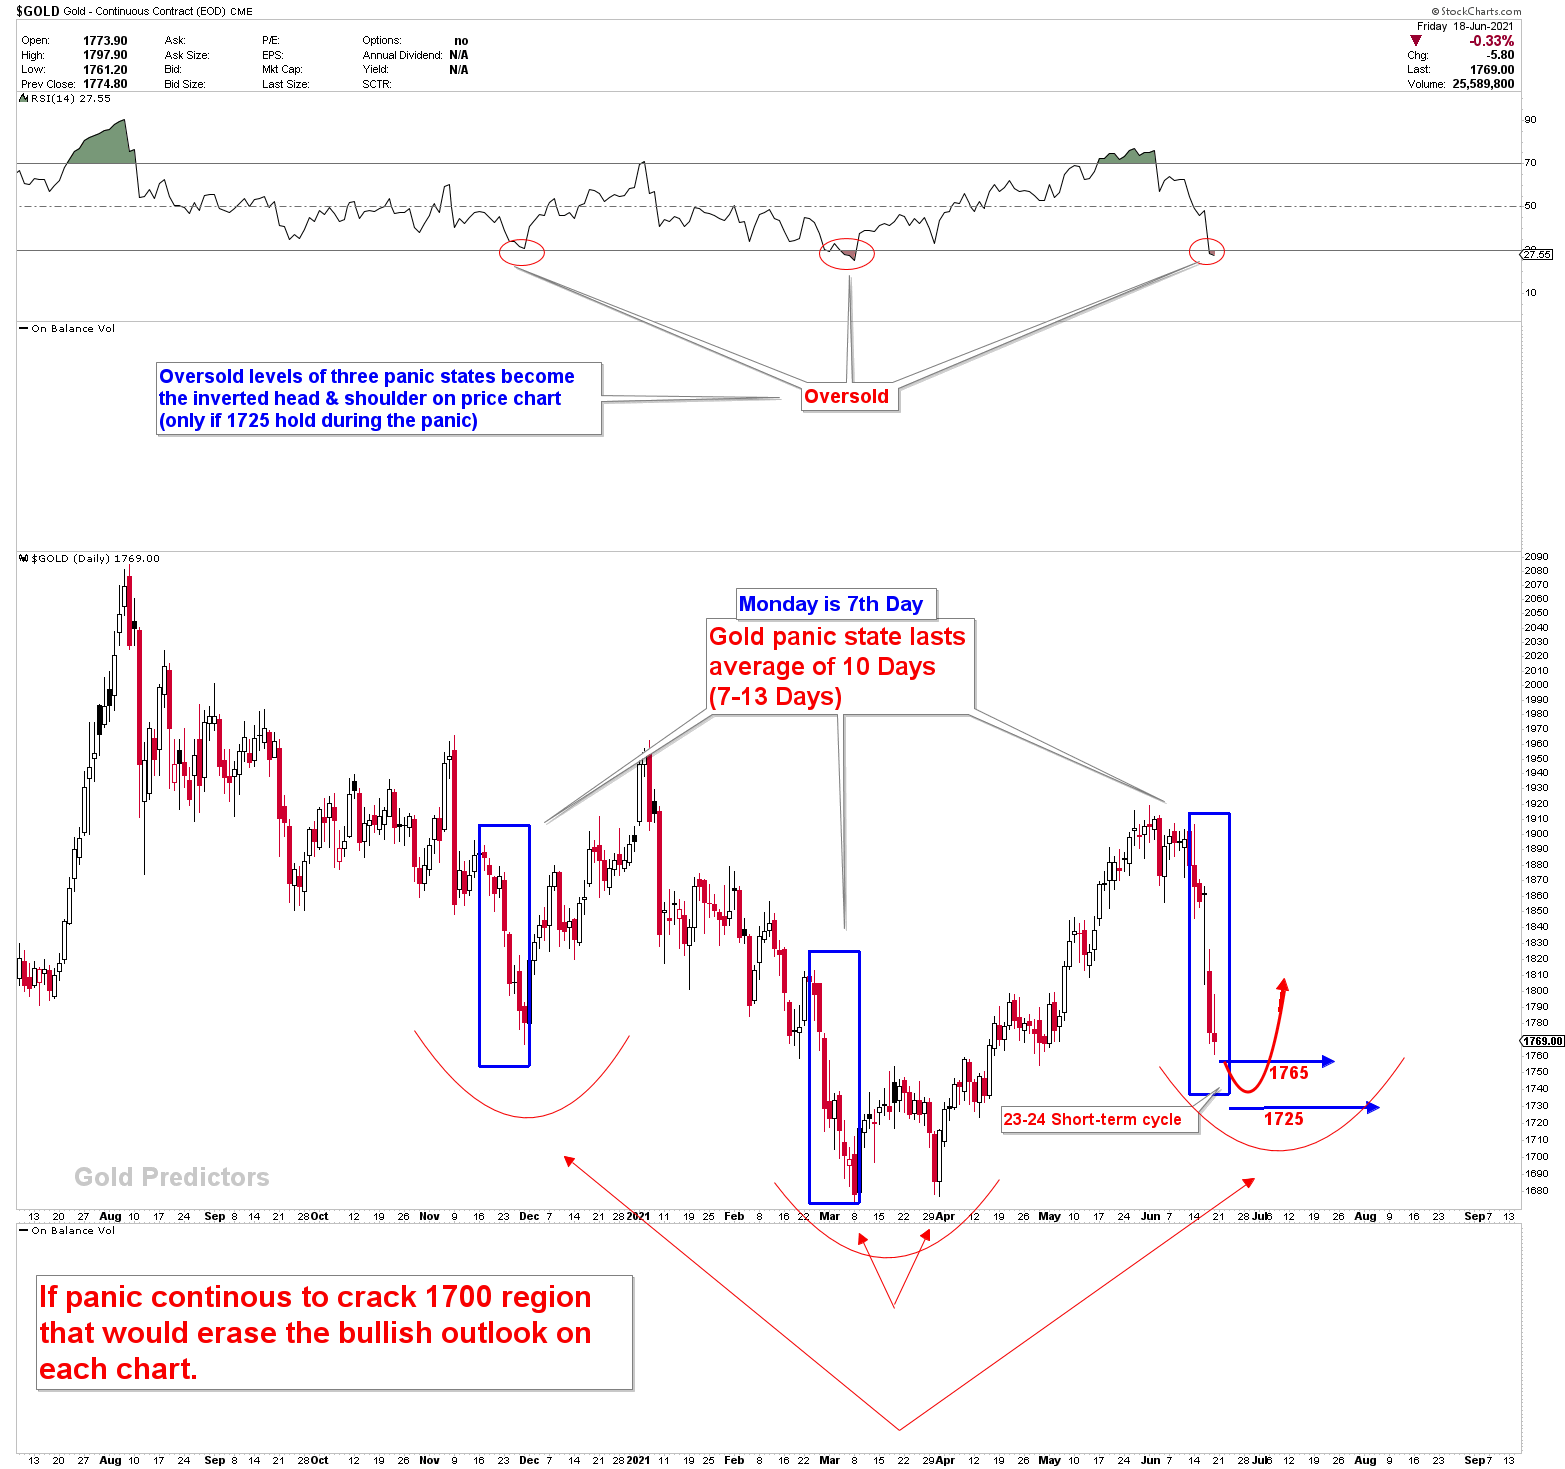
During the last six days, a decline from $1,900 to $1,760 has been observed in the gold market. This behavior is unusual, and it shows that gold is now in a panic state. This state can last from 8 to 12 days. After reaching the highest price ($2,070), gold has traded between $1,700 and $1,900. But if this yellow metal breaks inflection now, then it will be an escape from the long-term charts. It will result in a decline in the prices of gold. Because of the current panic state of gold, it is difficult to tell what will happen. But according to our chart mining calculations, there is a possibility of the following scenarios that may happen in June or July.
(Click on image to enlarge)
Possible gold scenarios in June and July
Due to the recent decline in gold prices, there is a panic created in the gold market. After the 1800 break, there are two numbers in the chart – one is $1,765, and the other is $1,725-$1,710. To summarize all the numbers, $1,680-$1,765 is a long-term mega inflection area. After the $1,680, the price structure will move from the current bull market to the bear market. Until Friday, gold maintained its prices at $1,765. But, unfortunately, its price declined below $1,765 at the last minute of Friday's close. This situation has created the following possible scenarios for the coming days.
Scenario 1. If Mega Inflection Holds
This is a possibility that the mega inflection area holds in the gold market, then prices may start to bottom in this region in June/July. It is expected that gold bottom in the month of June and July and starts increasing towards the targeted zones. If gold prices bottom at $1,725 or $1,765, then short-term charts will exhibit bottoming actions. This scenario has a 90% chance of happening.
(Click on image to enlarge)
Scenario 2. If Mega inflection is broken
Gold formed a bottom on the yearly inflection of $1,675 on 10th March’s diverged cycle. Based on our prediction, the gold prices are not likely to cross the $1,675 inflection area. But in case the prices exceed this level, there will be a threat to the long-term bull phase of gold, and gold prices may start declining. Out of all these scenarios, this scenario has the least chance to happen. Its probability is only 10%.
(Click on image to enlarge)
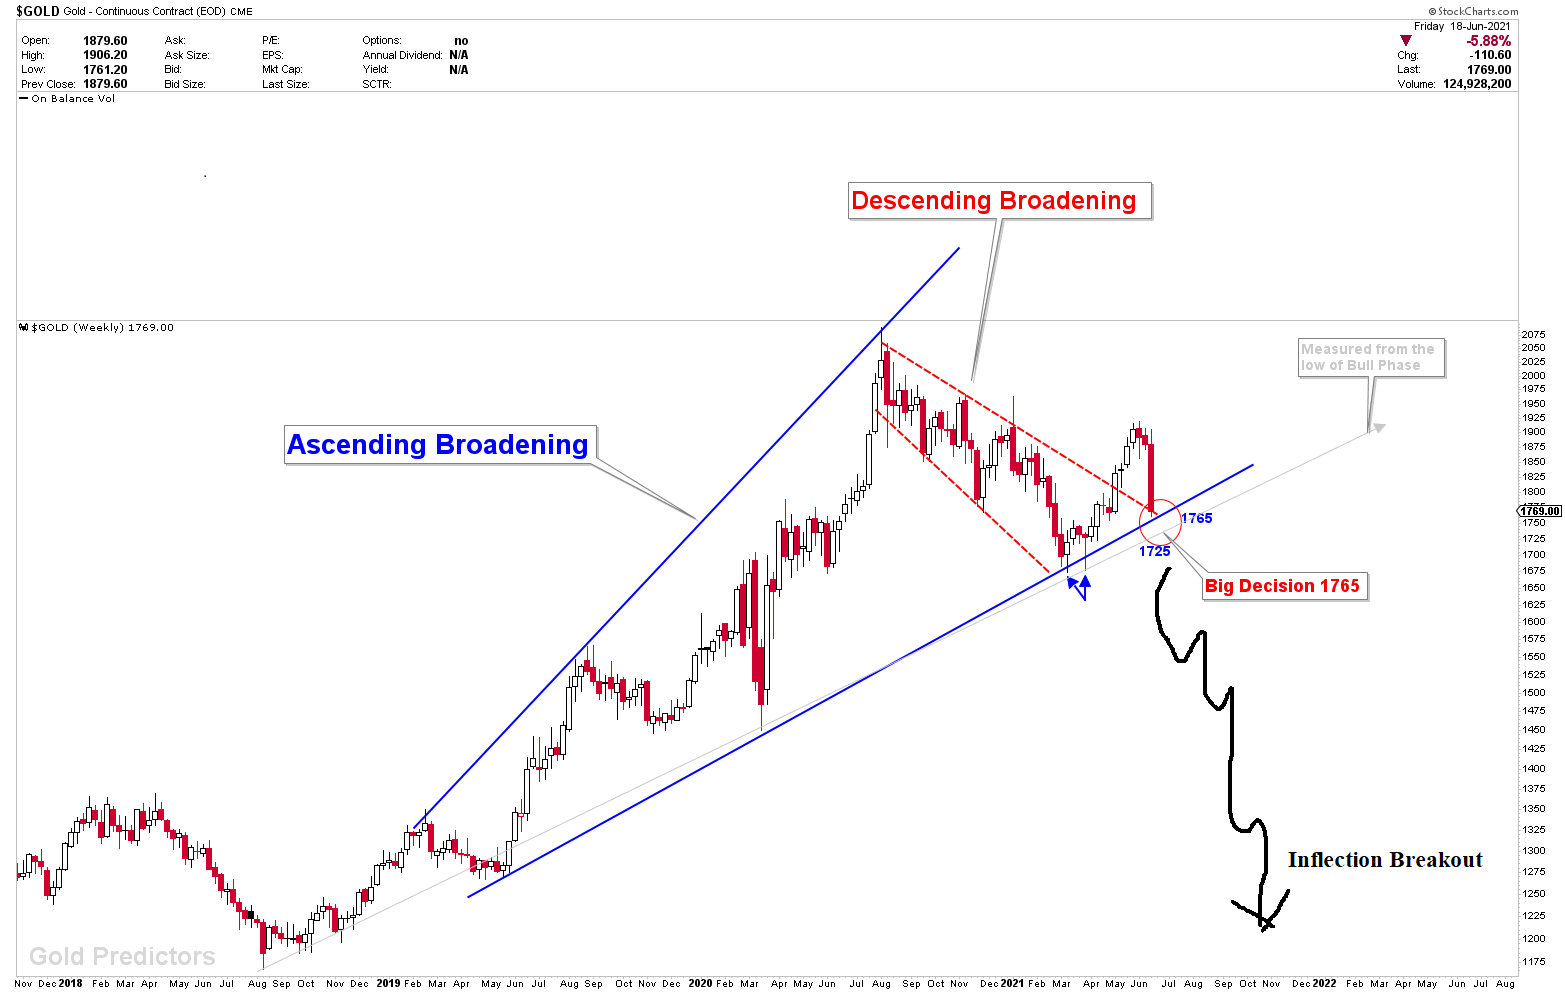
For the last seven months, the gold price patterns have been going well. Gold prices reduced from $2,000 to $1,700 as expected and then increased back to $1,900. You should keep in mind that the ascending broadening has a chance of 80% breakouts to the downwards. But we could not see the March breakout of $1,680 coming due to multiple factors.
Now the current inflection points are getting tested once again. A powerful bearish view will appear in the pattern if these inflection points are broken. Then this bearish view has a possibility of reducing gold prices dramatically. After the March/April 2021 rally, descending broadening was observed. It shows that there is a chance for prices to increase. However, an unexpected issue appeared last Friday when weekly closing prices went below $1,765. Because this happened unexpectedly and at the last minute, there is a chance that it is just a bear trap and soon prices will increase from $1,765-$1,725 level again.
Key Factors for Gold Bulls
With the continuous change in the economy, the prices of gold are expected to go higher this year. Many significant factors such as debt, inflation, bond rates, and the Fed’s balance sheet show that gold prices should jump higher soon. June/July are seasonal pullback months, and after the pullback is over, prices must return to their projected course.
Let’s what these factors are implying about gold.
The Fed’s balance sheet
The Fed’s balance sheet has expanded greatly over the past few years. It was nearly $880 billion before the occurrence of the financial crisis in 2008. After many quantitative easing, the balance sheet has expanded to nearly $8 trillion today. The Fed is continuously buying dollars to support the US economy.
(Click on image to enlarge)
.png)
US monetary base
The Fed’s balance sheet has a direct effect on the US monetary base. In 2007, it was around $800 to $900 billion. Then with the start of the financial crisis, Fed kept buying Treasuries and supporting the US economy which led to the increase in the monetary base, too. Today, the US monetary base has reached nearly $6 trillion. It is expected to keep expanding with time.
(Click on image to enlarge)
.png)
US federal debt
Like the Fed’s balance sheet and US monetary base, US federal debt also keeps on increasing. Today, it has reached approximately $23 trillion. Also, the Fed debt to GDP ratio has also increased to 128% which is many times higher than the value during previous years. The US spends around $3.6 trillion more than it produces. The current pandemic has worsened this condition even more.
(Click on image to enlarge)
.png)
US treasury
Like other forms of debt, US federal debt should be serviced. The US has a debt load of around $23 trillion. And the servicing yields of America resemble the 10-year yield. At the present debt situation, the taxpayers will have to pay around $380 billion in the servicing payments of the whole year. So, we can see that the load of the US debt will keep on increasing constantly in the coming years.
(Click on image to enlarge)
.png)
Funds rate
Before Fed was able to increase the fund rates and keep them the same but today it cannot do it anymore. From 2016 to 2018, the Fed did try to normalize the fund rates, but then it was found out that the US economy could not work well with the fund rates higher than 2 percent. The system has to pay a huge debt and its economy has gotten used to oddly low fund rates. So, an increase in the fund rates in the future is not expected.
CPI inflation
CPI inflation is used to measure consumer inflation. Today, CPI shows an increase of 4.2% YoY which has happened for the first time after 2008. In 2008, fund rates were around 5% but today they are zero. Now a heightened inflationary environment has been created during the low funds' rate era.
PPI inflation
PPI inflation shows that the YoY producer prices have elevated by around 10%. This is a huge number. People saying that it is most probably due to the pandemic must check the MoM chart. This chart shows the increase in the prices continuously during the last months. PPI inflation is expected to keep on increasing in the near future.
What will happen to the gold now?
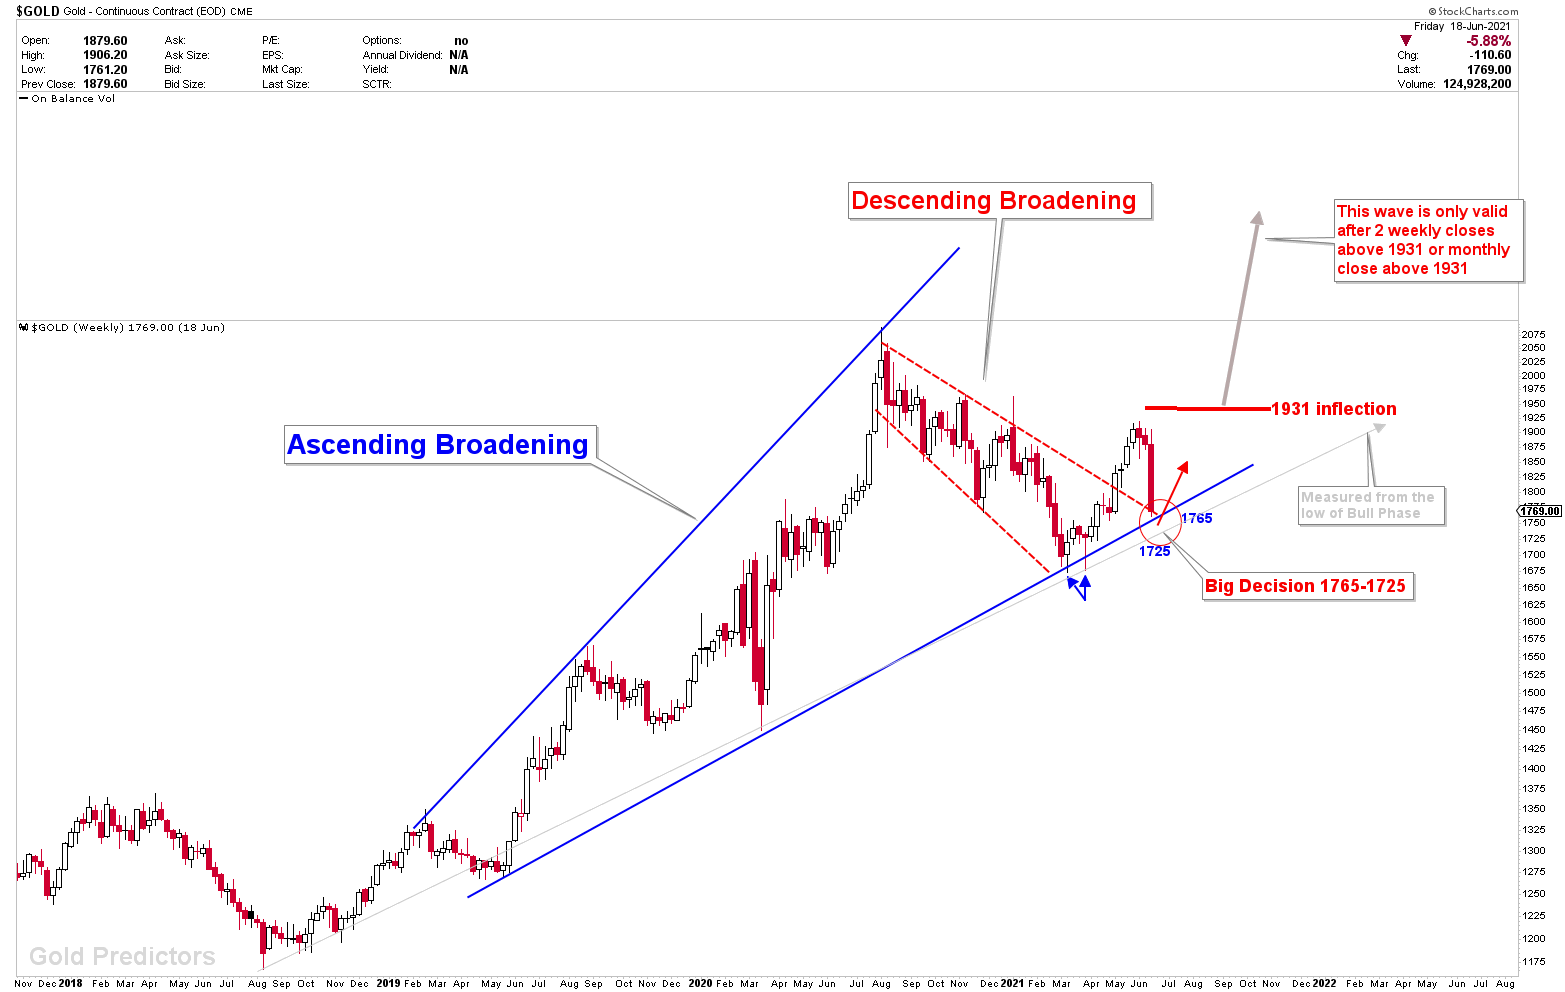
According to our analysis, gold is now at long-term inflection points. If inflections lead to the downside, there is a chance for prices to challenge the long-term gold bull phase that started in the year 2019. Contrarily, if a bottom formed at the inflection points, then there is a possibility for prices to increase and reach towards $1,931 inflection at least. If $1,931 gives way, then a much higher price will emerge above $2,120 and $2,300. For now, we can just be patient and observe the patterns. We will measure the right figures according to the changing patterns.
Due to the current panic state, it is expected that a short-term bottom will appear due to the short-term cycle days of 23 or 24 June. Things have not changed if we look at them from the fundamental POV. Debts are still rising, the monetary base is also expanding, inflation is also increasing, and treasuries are still passive.
According to our analysis, gold prices will establish a bottom during June/July. But we cannot tell how deep this bottom will be due to the current panic in the gold market. According to the stats of the last few weeks, $1,725 and $1,765 are still the big support numbers. The panic in the gold market usually lasts 7-12 days, with a 10-day average. And Monday is the seventh day of the panic state, and we believe $1,765 was a bear trap in the final seconds of Friday's closing. The expected short-term cycle dates are June 23-24, implying that a bottom could emerge at any time, at least for the short-term bounce. On the other hand, the June/July pullbacks are a very healthy sign of the strong rally in August/September, as per 20 years of chart data.
Disclaimer: Articles/Short-term & Long-term Trading signals/Newsletters distributed by GoldPredictors.com has no regard to the specific investment objectives, financial situation or the ...
more

