
Advertisement
Advertisement
Ethereum, Litecoin, and Ripple’s XRP – Daily Tech Analysis – June 22nd, 2021
By:
It's back into the red for the majors after Monday's rout. Failure to move through the day's pivot levels would leave the trio under pressure throughout the day.

Ethereum
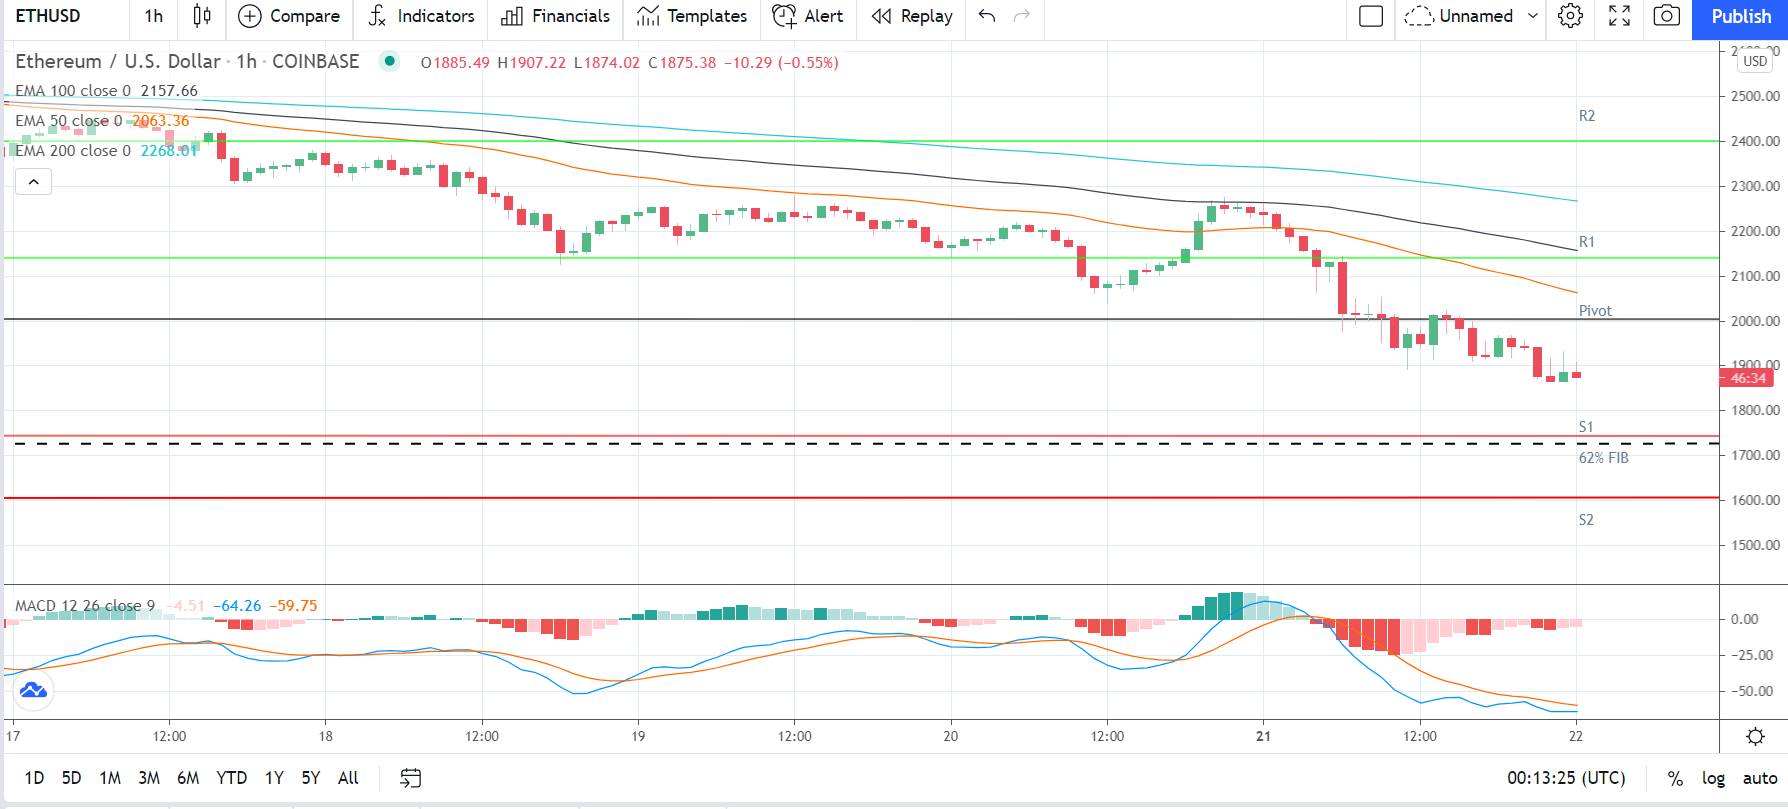
Ethereum slid by 15.93% on Monday. Reversing a 3.59% gain from Sunday, Ethereum ended the day at $1,885.67.
A mixed start to the day saw Ethereum rise to an early morning intraday high $2,259.10 before hitting reverse.
Falling short of the first major resistance level at $2,332, Ethereum slid to a late intraday low $1,864.50.
The extended sell-off saw Ethereum fall through the first major support level at $2,098 and the second major support level at $1,954.
Steering clear of sub-$1,800 support levels, Ethereum briefly revisited $1,931 levels before easing back.
At the time of writing, Ethereum was down by 0.55% to $1,875.38. A mixed start to the days saw Ethereum rise to an early morning high $1,907.22 before falling to a low $1,874.02.
Ethereum left the major support and resistance levels untested early on.
For the day ahead
Ethereum would need to move through the $2,003 pivot to bring the first major resistance level at $2,142 into play.
Support from the broader market would be needed, however, for Ethereum to break back through to $2,100 levels.
Barring an extended crypto rally, the first major resistance level would likely cap any upside.
In the event of a broad-based crypto rebound, Ethereum could test resistance at $2,300. The second major resistance level sits at $2,398.
Failure to move through the $2,003 pivot would bring the first major support level at $1,747 and the 62% FIB of $1,725 into play.
Barring another extended sell-off, however, Ethereum should steer clear of sub-$1,700 levels. The second major support level sits at $1,609.
Looking at the Technical Indicators
First Major Support Level: $1,747
Pivot Level: $2,003
First Major Resistance Level: $2,142
23.6% FIB Retracement Level: $3,369
38.2% FIB Retracement Level: $2,740
62% FIB Retracement Level: $1,725
Litecoin
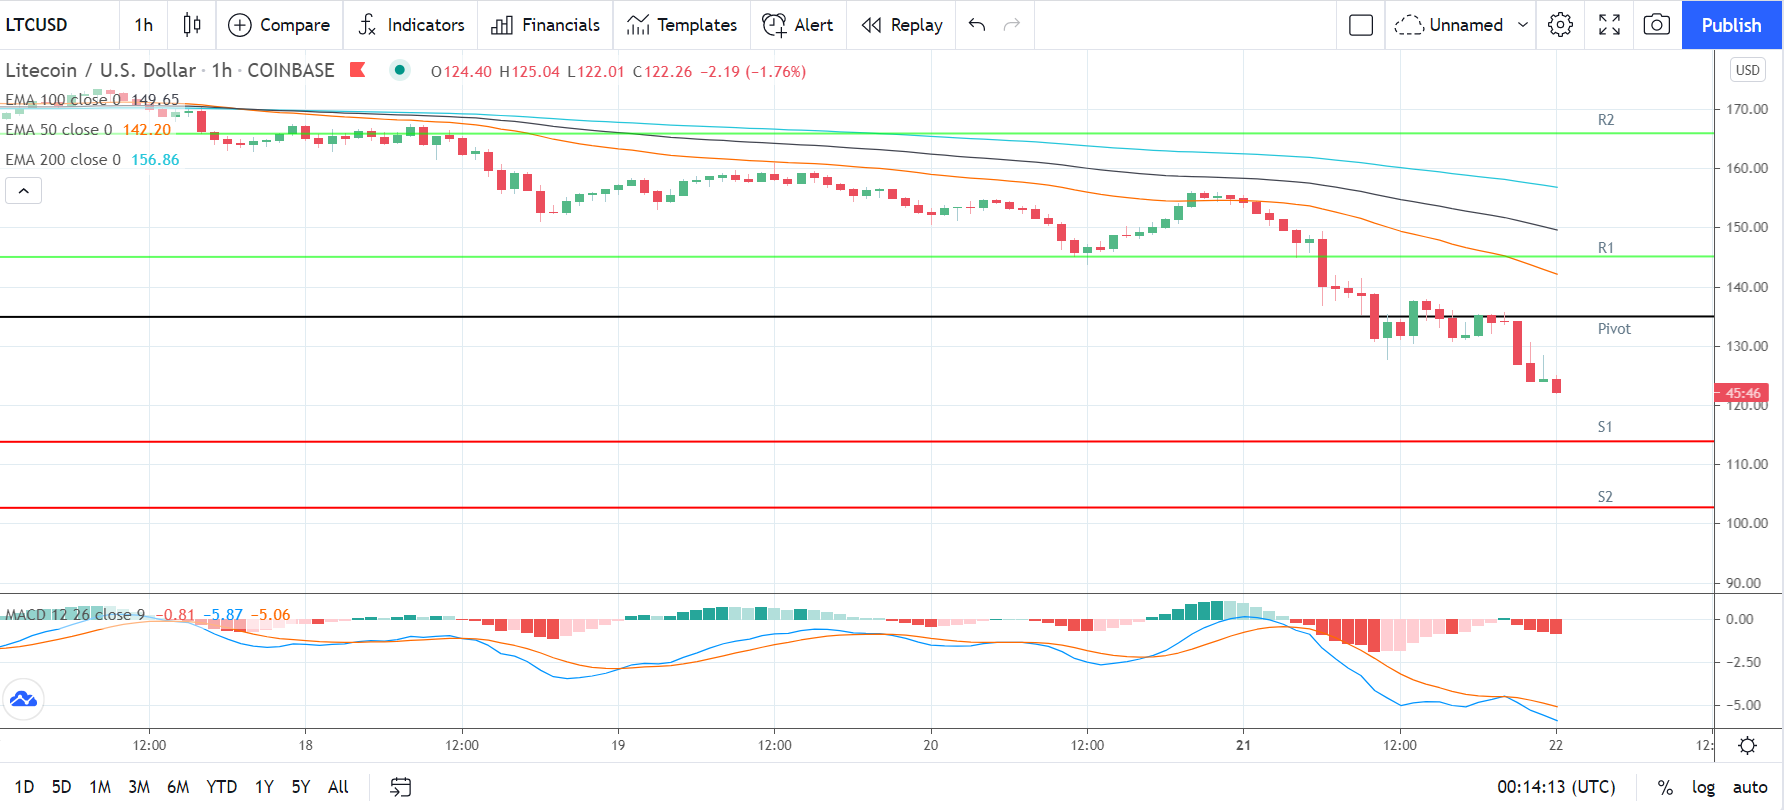
Litecoin tumbled by 19.65% on Monday. Reversing a 1.50% gain from Sunday, Litecoin ended the day at $124.45.
Tracking the broader market, Litecoin rose to an early morning intraday high $155.45 before hitting reverse.
Falling short of the first major resistance level at $160, Litecoin slid to a late intraday low $124.02.
Litecoin fell through the day’s major support levels to end the day at sub-$125 levels. The third major support level at $127 pinned Litecoin back late in the day.
At the time of writing, Litecoin was down by 1.76% to $122.26. A mixed start to the day saw Litecoin rise to an early morning high $125.04 before falling to a low $122.01.
Litecoin left the major support and resistance levels untested early on.
For the day ahead
Litecoin would need to move through the $135 pivot to bring the first major resistance level at $145 into play.
Support from the broader market would be needed, however, for Litecoin to break back through to $140 levels.
Barring an extended crypto rally, the first major resistance level would likely cap any upside.
In the event of an extended breakout, Litecoin could test resistance at $160. The second major resistance level sits at $166.
Failure to move through the $135 pivot would bring the first major support level at $114 into play.
Barring another extended sell-off, however, Litecoin should steer clear of sub-$110 levels. The second major support level sits at $103.
A sustained fall through the 62% FIB of $174 led to a near-term bearish trend formation from 10th May’s swing hi $413.91.
Looking at the Technical Indicators
First Major Support Level: $114
Pivot Level: $135
First Major Resistance Level: $145
23.6% FIB Retracement Level: $188
38.2% FIB Retracement Level: $231
62% FIB Retracement Level: $301
Ripple’s XRP
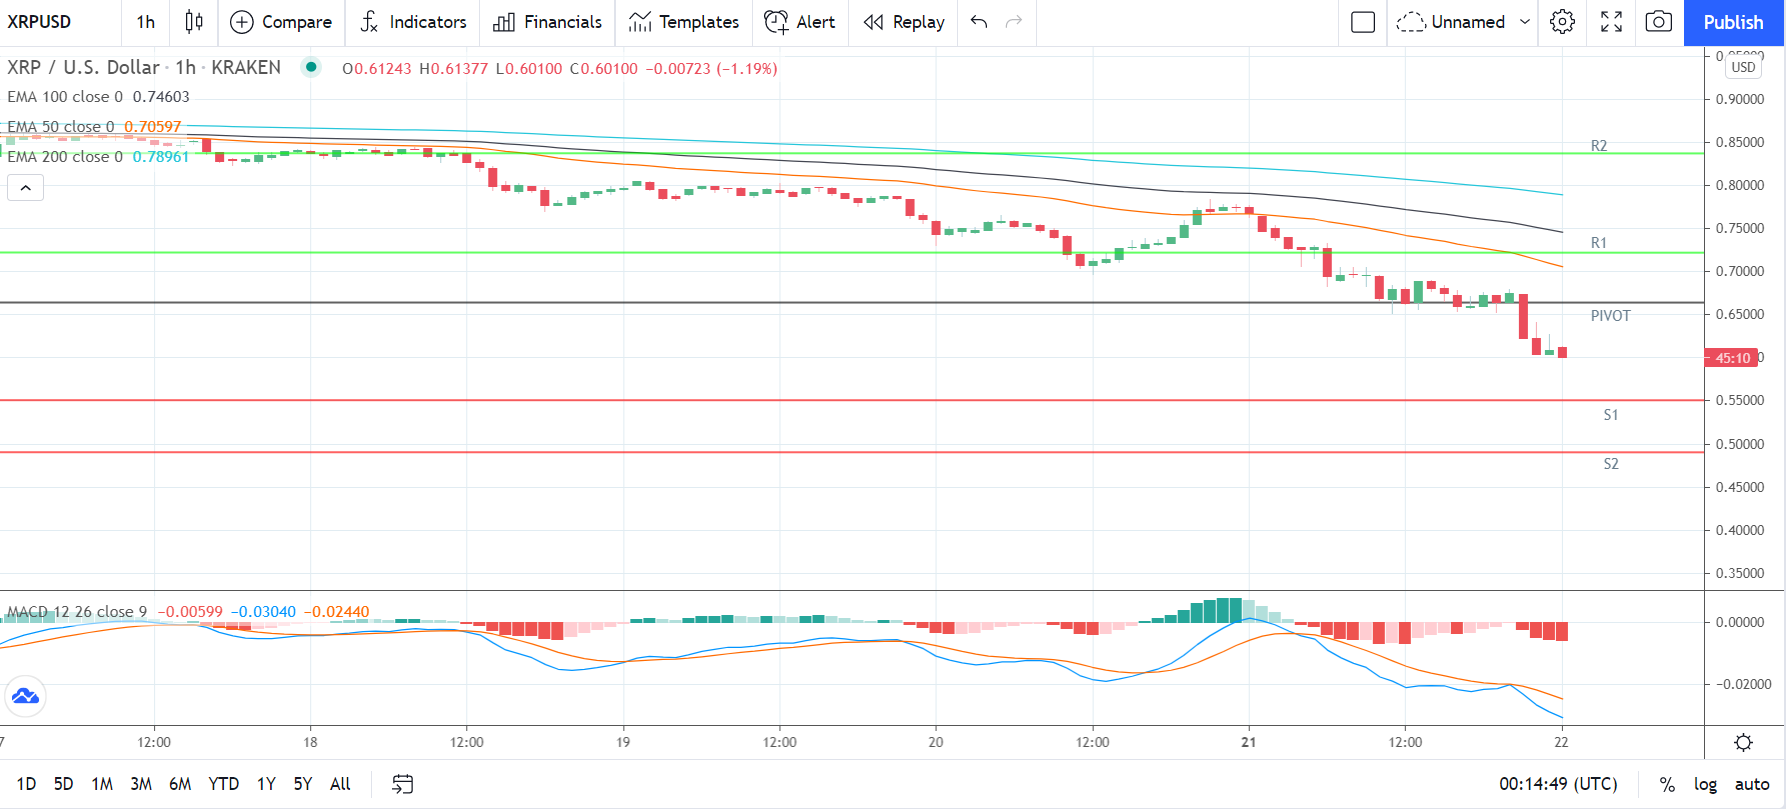
Ripple’s XRP slumped by 21.53% on Monday. Reversing a 2.07% gain from Sunday, Ripple’s XRP ended the day at $0.60823.
A mixed start to the day saw Ripple’s XRP rise to an early morning intraday high $0.77731 before hitting reverse.
Falling short of the first major resistance level at $0.8063, Ripple’s XRP slid to a late intraday low and a new swing lo $0.60442.
The extended sell-off saw Ripple’s XRP slide through the first major support level at $0.7196 and the second major support level at $0.6650.
A late revisit to $0.62 levels was short lived, with support at $0.60 preventing heavier losses on the day.
At the time of writing, Ripple’s XRP was down by 1.19% to $0.60100. A mixed start to the day saw Ripple’s XRP rise to an early morning high $0.61377 before falling to a low $0.60100.
Ripple’s XRP left the major support and resistance levels untested early on.
For the day ahead
Ripple’s XRP will need to move through the $0.6633 pivot to bring the first major resistance level at $0.7222 into play.
Support from the broader market would be needed, however, for Ripple’s XRP to break back through to $0.70 levels.
Barring an extended crypto rally, the first major resistance level would likely cap any upside.
In the event of a broad-based crypto rebound, Ripple’s XRP could test resistance at $0.80. The second major resistance level sits at $0.8362.
Failure to move through the $0.6633 pivot would bring the first major support level at $0.5493 into play.
Barring another extended sell-off, however, Ripple’s XRP should steer clear of the second major support level at $0.4904.
A sustained fall through the 62% FIB of $0.8573 led to the formation of a near-term bearish trend from 14th April’s swing hi $1.96598.
Looking at the Technical Indicators
First Major Support Level: $0.5493
Pivot Level: $0.6633
First Major resistance Level: $0.7222
23.6% FIB Retracement Level: $0.9258
38.2% FIB Retracement Level: $1.1246
62% FIB Retracement Level: $1.4459
Please let us know what you think in the comments below.
Thanks, Bob
About the Author
Bob Masonauthor
With over 20 years of experience in the finance industry, Bob has been managing regional teams across Europe and Asia and focusing on analytics across both corporate and financial institutions. Currently he is covering developments relating to the financial markets, including currencies, commodities, alternative asset classes, and global equities.
Did you find this article useful?
Latest news and analysis


Advertisement