
Advertisement
Advertisement
EUR/USD Mid-Session Technical Analysis for June 22, 2021
By:
The direction of the EUR/USD on Tuesday is likely to be determined by trader reaction to the Fibonacci level at 1.1919.

In this article:
The Euro is inching lower against the U.S. Dollar on Tuesday as investors await comments from Federal Reserve Chairman Jerome Powell at 18:00 GMT. The Fed last week signaled a potentially tougher stance on inflation and shifted projections for its first two hikes into 2023, sparking a sell-off in U.S. stocks, boosting the dollar and flattening the Treasury yield curve in its fastest reshaping since March 2020.
At 13:34 GMT, the EUR/USD is trading 1.1905, down 0.0014 or -0.11%.
Today’s subdued trading action suggests investors aren’t sure what Powell will say, but it also suggests the possibility of volatility later in the session.
Some traders expect Powell will try to reverse some of the damage caused by last Wednesday’s Federal Reserve announcements. In this case, he’ll try to soften the hawkish message the Fed delivered in revealing the surprise change in policy.
Others believe Powell will continue to acknowledge that economic conditions are improving, while reiterating that the economy is just not there yet.
Essentially, traders will be looking to see if Powell mentions a stronger labor market could encourage policy normalization should start in the months to come. If he does then look for another pullback in the EUR/USD. If he doesn’t then look for the start of a short-covering rally.
Daily Swing Chart Technical Analysis
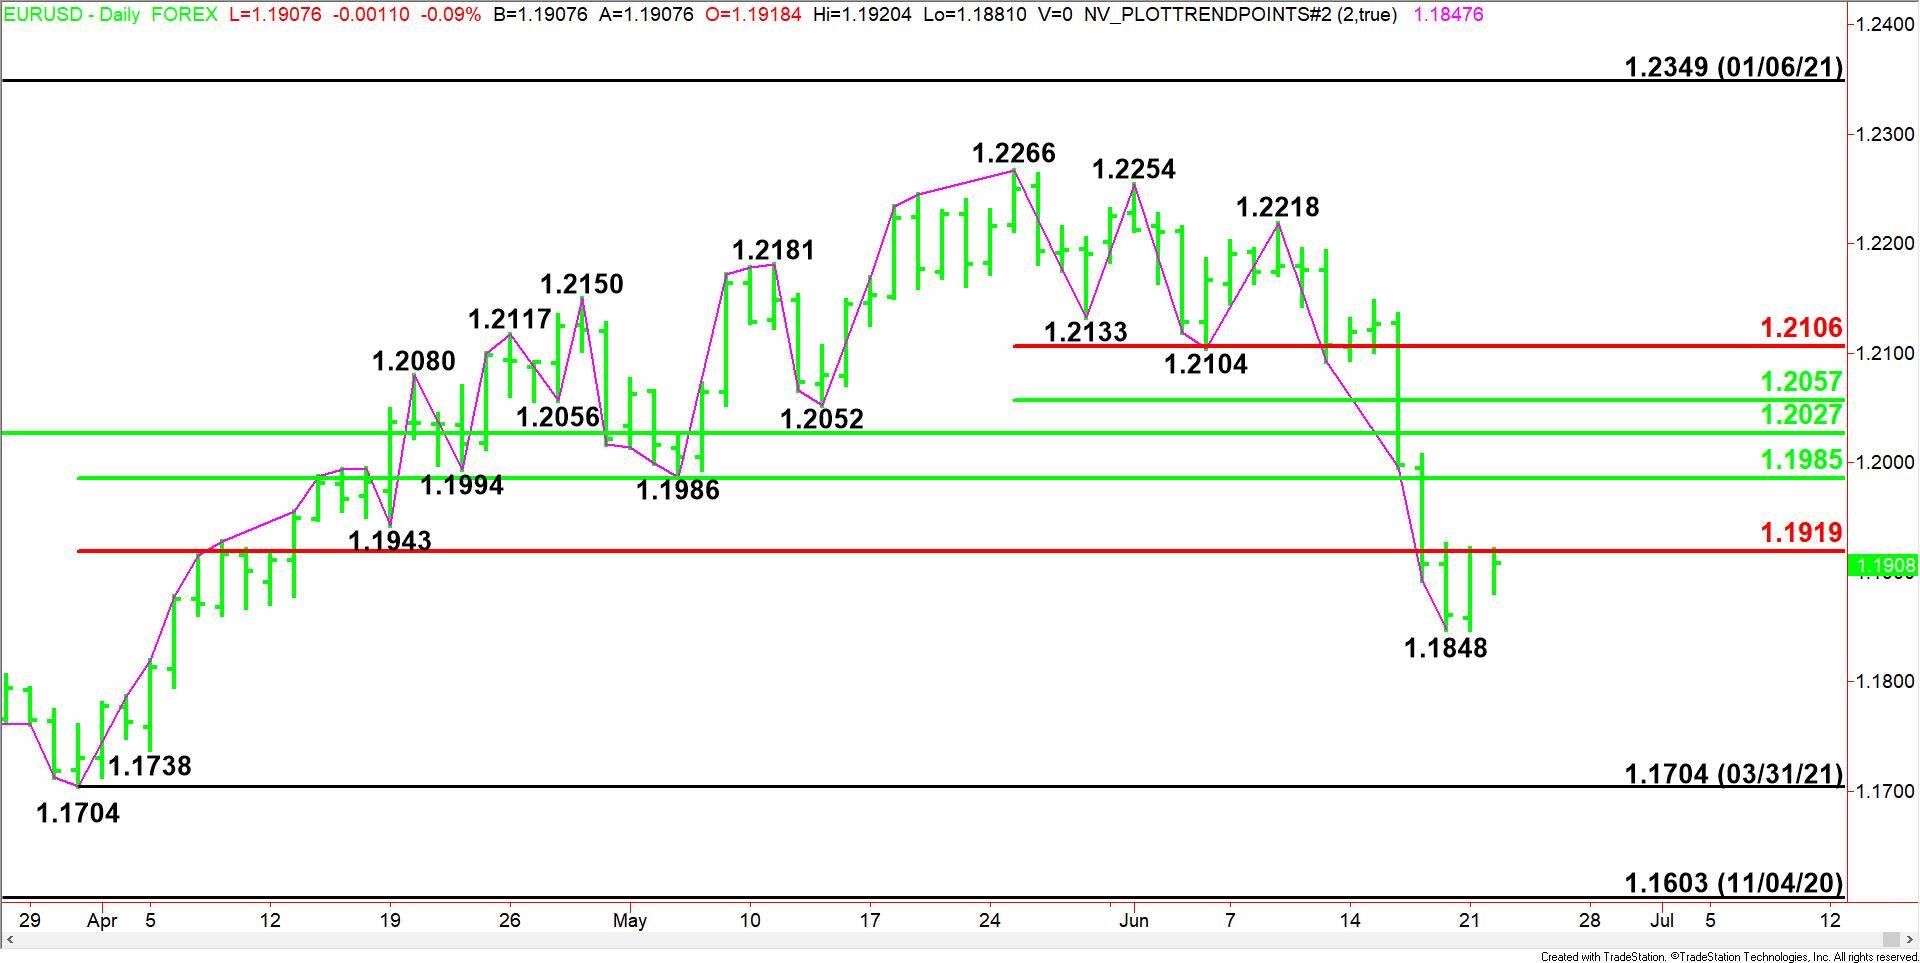
The main trend is down according to the daily swing chart. A trade through 1.1848 will signal a resumption of the downtrend with 1.1704 the next near-term target. A move through 1.2218 will change the main trend to up. This is highly unlikely, but there is room for a normal retracement of the last sell-off.
The main range is 1.1704 to 1.2266. The EUR/USD is currently trading on the weak side of its retracement zone at 1.1919 to 1.1985, making it resistance. The longer-term 50% level at 1.2027 is additional resistance.
The short-term range is 1.2266 to 1.1848. Its retracement zone at 1.2057 to 1.2106 is the primary upside target of the current chart pattern.
Daily Swing Chart Technical Forecast
The direction of the EUR/USD on Tuesday is likely to be determined by trader reaction to the Fibonacci level at 1.1919.
Bearish Scenario
A sustained move under 1.1919 will indicate the presence of sellers with 1.1848 the next likely target. Taking out this level could trigger the start of an eventual sell-off with 1.1704 the primary downside target.
Bullish Scenario
A sustained move over 1.1919 will signal the presence of buyers. If this creates enough upside momentum then look for the rally to possibly extend into a series of retracement levels at 1.1985, 1.2027, 1.2057 and 1.2106 over the near-term. Sellers are likely to come in following a test of 1.2057 to 1.2106.
For a look at all of today’s economic events, check out our economic calendar.
About the Author
James Hyerczykauthor
James is a Florida-based technical analyst, market researcher, educator and trader with 35+ years of experience. He is an expert in the area of patterns, price and time analysis as it applies to futures, Forex, and stocks.
Did you find this article useful?
Latest news and analysis


Advertisement