
Advertisement
Advertisement
NZD/USD Forex Technical Analysis – Holding .7027 Could Create Upside Momentum Needed to Challenge .7083
By:
The direction of the NZD/USD on Thursday is likely to be determined by trader reaction to .7027.

In this article:
The New Zealand Dollar is trading slightly higher on Thursday as investors look to extend its three day counter-trend rally. Underpinning the currency has been steady demand for riskier assets this week. Helping to put a lid on the Kiwi are conflicting signals from Federal Reserve officials on the timing of a withdrawal of monetary stimulus.
At 08:04 GMT, the NZD/USD is trading .7053, up 0.0007 or +0.09%.
While global equity markets have been pressing higher, two Fed officials said that a period of high inflation in the United States could last longer than anticipated, a day after Fed Chair Jerome Powell had played down rising price pressures.
The mixed signals from the Fed and strong demand for riskier assets is helping to create a little caution in the trade. Although the NZD/USD is threatening to move higher for a third session, the rally is still just in the short-covering phase.
Traders will now shift their focus to today’s U.S. economic reports including Final Quarterly GDP, Durable Goods and Weekly Jobless Claims.
Daily Swing Chart Technical Analysis
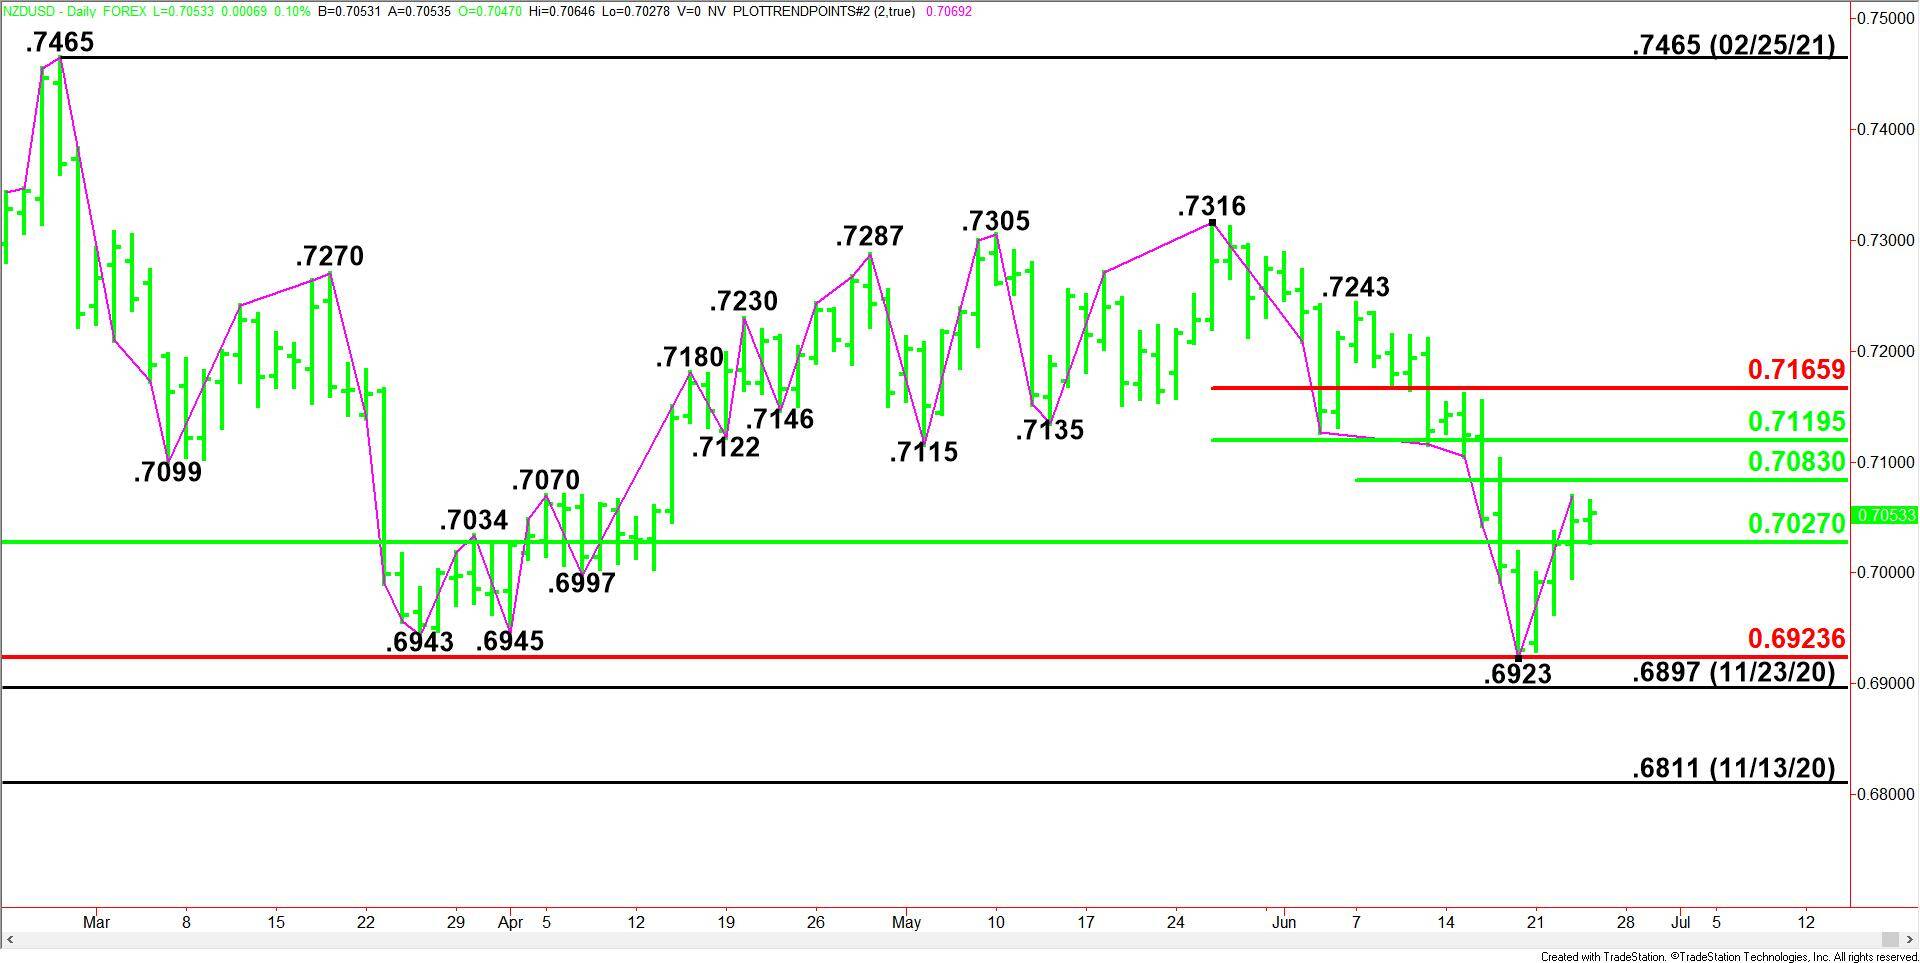
The main trend is down according to the daily swing chart. A trade through .6923 will signal a resumption of the downtrend. The main trend will change to up on a move through .7316.
The minor trend is also down. A trade through .7243 will change the minor trend to up. This will shift momentum to the upside.
The main range is .6589 to .7465. After a successful test, the NZD/USD is currently trading on the strong side of its retracement zone at .7027 to .6924, making it new support.
The minor range is .7243 to .6923. Its 50% level at .7083 is the nearest resistance.
The short-term range is .7316 to .6923. Its retracement zone at .7120 to .7166 is the primary upside target.
Daily Swing Chart Technical Forecast
The direction of the NZD/USD on Thursday is likely to be determined by trader reaction to .7027.
Bullish Scenario
A sustained move over .7027 will indicate the presence of buyers. This could lead to the start of a labored rally with targets lined up at .7083, .7120 and .7166.
Bearish Scenario
A sustained move under .7027 will signal the presence of sellers. The first downside target is a minor pivot at .6996. If this fails as support then look for the selling to possibly extend into the support cluster at .6924 – .6923, followed by the November 23, 2020 main bottom at .6897.
For a look at all of today’s economic events, check out our economic calendar.
About the Author
James Hyerczykauthor
James is a Florida-based technical analyst, market researcher, educator and trader with 35+ years of experience. He is an expert in the area of patterns, price and time analysis as it applies to futures, Forex, and stocks.
Did you find this article useful?
Latest news and analysis


Advertisement