
Advertisement
Advertisement
USD/JPY Forex Technical Analysis – Close Under 110.964 Forms Potentially Bearish Minor Reversal Top
By:
The direction of the USD/JPY on Thursday is likely to be determined by trader reaction to 110.964.

In this article:
Mixed signals from Federal Reserve policymakers and profit-taking are helping to drive the Dollar/Yen lower on Thursday, despite firm Treasury yields and strong demand for global equities. Earlier in the session, the Forex pair hit its highest level since March 2020 as investors continued to bet on the U.S. economy outperforming the Japanese economy.
At 08:59 GMT, the USD/JPY is trading 110.871, down 0.093 or -0.08%. This is down from an intraday high of 111.117.
The Dollar/Yen got some support earlier in the session as two Fed officials said that a period of high inflation in the United States could last longer than anticipated, a day after Fed Chair Jerome Powell played down rising price pressures. This news came a day after Fed Chair Powell played down the surge in inflation, saying rates were climbing due to a “perfect storm” as the economy reopens from the COVID-19 pandemic, and that those price pressures should ease on their own.
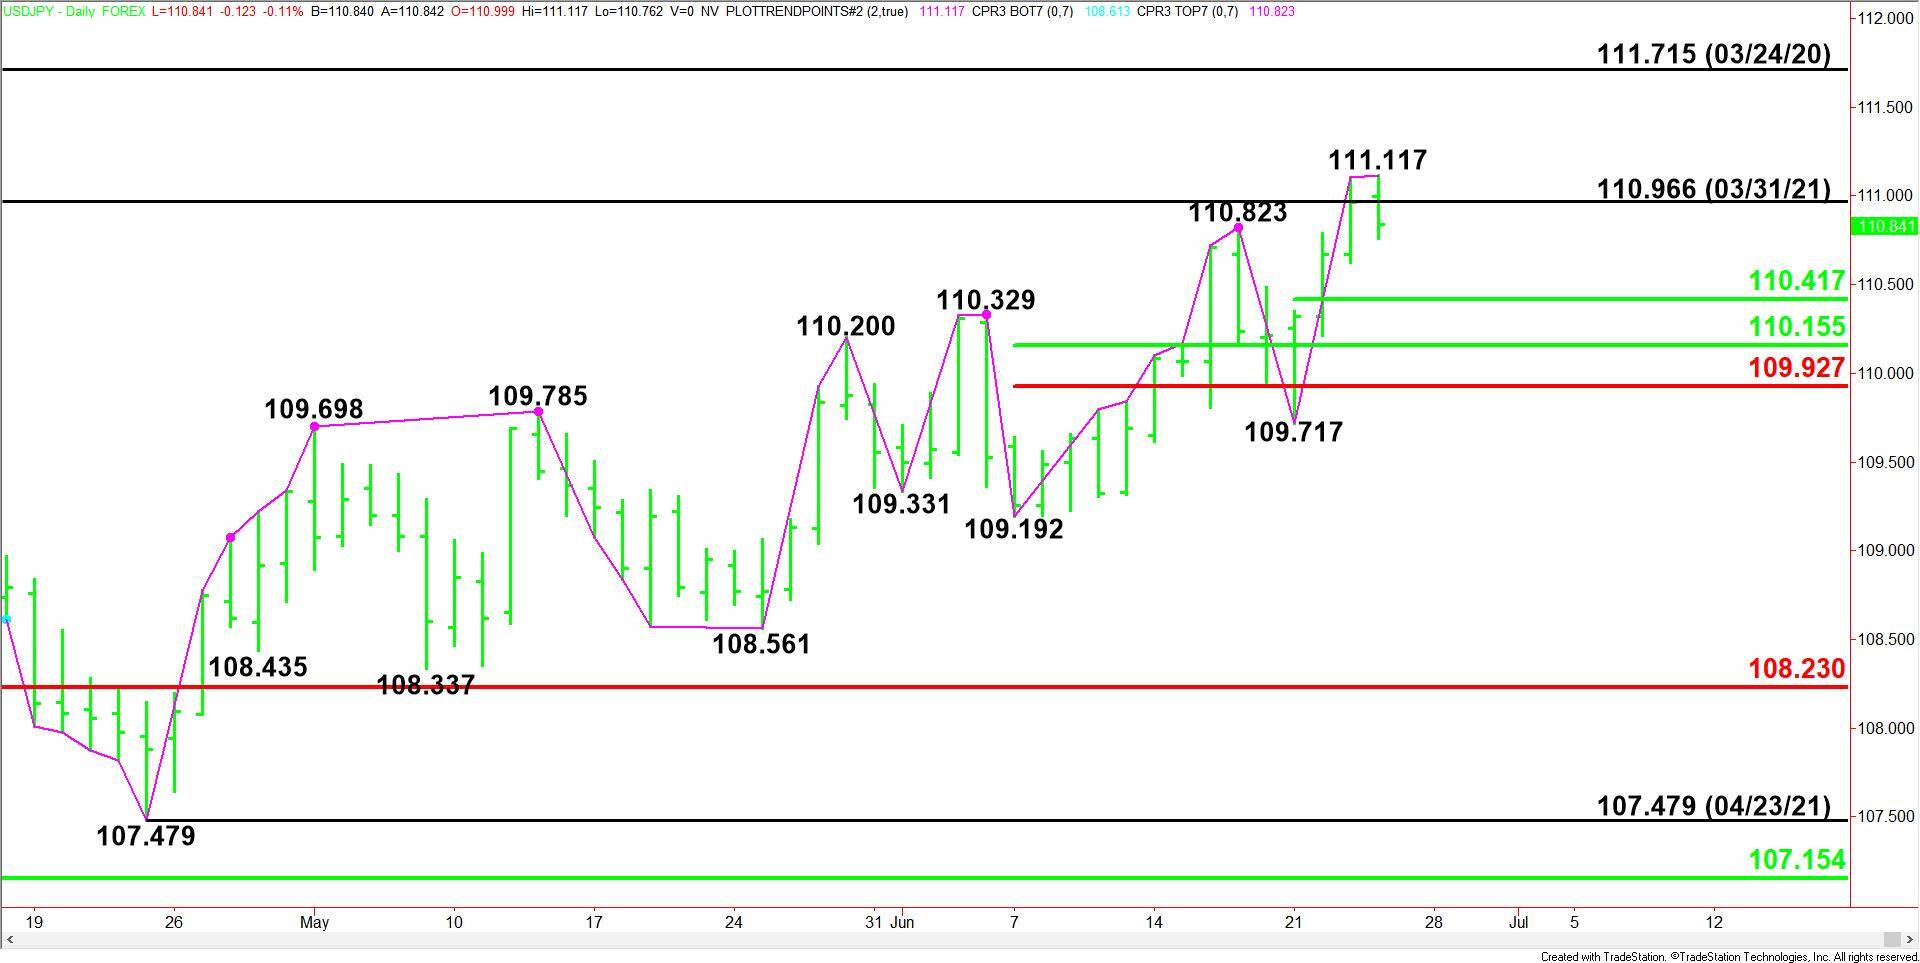
Daily Swing Chart Technical Analysis
The main trend is up according to the daily swing chart. The uptrend will be reaffirmed if buyers take out the intraday high at 111.117. A trade through 109.717 will change the main trend to down.
The minor range is 109.717 to 111.117. Its 50% level at 110.417 is the nearest support.
The short-term range is 109.192 to 111.117. Its retracement zone at 110.155 to 109.927 is another potential support area and the last before the main bottom at 109.717.
Daily Swing Chart Technical Forecast
The direction of the USD/JPY on Thursday is likely to be determined by trader reaction to 110.964.
Bullish Scenario
A sustained move over 110.964 will indicate the presence of buyers. The first upside target is the intraday high at 111.117. Taking out this level will indicate the buying is getting stronger. If this move continues to generate enough upside momentum then look for an eventual rally into the March 24, 2020 main top at 111.715.
Bearish Scenario
A sustained move under 110.964 will signal the presence of sellers. If this move attracts enough intraday selling pressure then look for the move to possibly extend into 110.417. Look for buyers on the first test of this level. If it fails then look for the new sellers to drive the Forex pair into 110.155 to 109.927.
For a look at all of today’s economic events, check out our economic calendar.
About the Author
James Hyerczykauthor
James is a Florida-based technical analyst, market researcher, educator and trader with 35+ years of experience. He is an expert in the area of patterns, price and time analysis as it applies to futures, Forex, and stocks.
Did you find this article useful?
Latest news and analysis


Advertisement