
Oil Price Outlook Hinges On OPEC JMMC Meeting

The price of oil pulls back from a fresh yearly high ($74.25) even as US inventories narrow for the fifth consecutive week, and crude may face headwinds ahead of the OPEC Joint Ministerial Monitoring Committee (JMMC) meeting on July 1 as the group sticks to the production adjustment table.
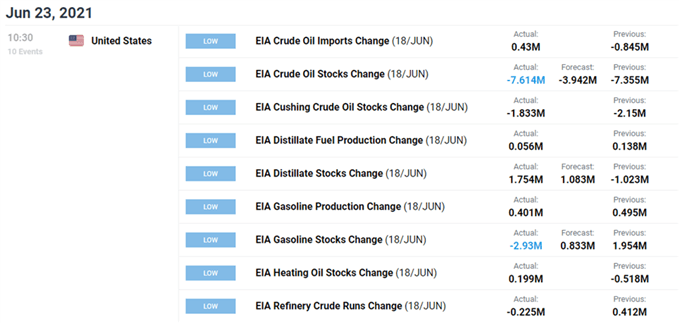
Nevertheless, fresh data prints coming out of the US may encourage OPEC+ to unveil an updated production schedule as stockpiles contract 7.614M in the week ending June 18 after falling 7.355M the week prior, and the group may continue to boost supply over the coming months as US output slows for the first time since late May.
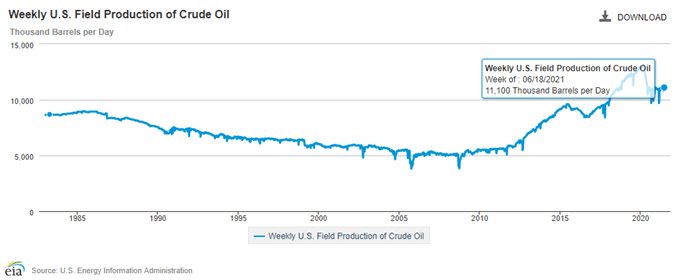
A deeper look at the figures coming out of the Energy Information Administration (EIA) showed weekly field production slipping to 11,100K from 11,200K in the week ending June 11, and the tepid recovery in US output may prop up the price of oil as it remains below pre-pandemic levels.
With that said, the price of oil may continue to exhibit the bullish trend from earlier this year as the recovery in global demand is met with limited supply, but crude may face a larger pullback ahead of the OPEC+ meeting as the Relative Strength Index (RSI) falls back from overbought territory to indicate a textbook sell signal.
OIL PRICE DAILY CHART
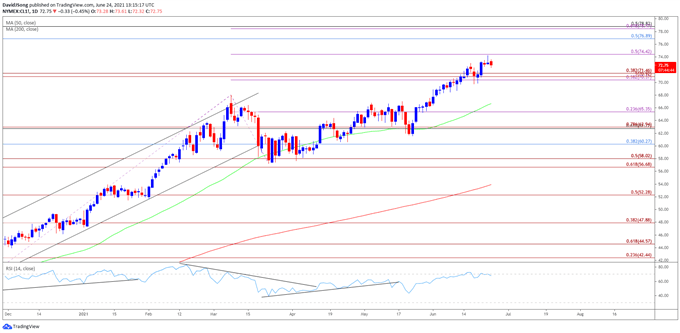
Source: Trading View
- Keep in mind, crude broke out of the range-bound price action from the third quarter of 2020 as it established an upward trending channel, with the price of oil taking out the 2019 high ($66.60) as both the 50-Day SMA ($66.65) and 200-Day SMA ($53.93)established a positive slope.
- The price of oil may continue to exhibit a bullish trend as the recent rally removes the threat of a double-top formation, but the rally appears to have stalled ahead of the 2018 high ($76.90) as it pulls back from a fresh yearly high ($74.25).
- The Relative Strength Index (RSI) highlights a similar dynamic as it falls back from overbought territory and slips below 70 to indicate a textbook sell signal.
- Lack of momentum to break/close above the $74.40 (50% expansion) region may pull the price of oil back towards the Fibonacci overlap around $70.40 (38.2% expansion) to $71.50 (38.2% expansion), with a move below the 50-Day SMA ($66.65) bringing the $65.40 (23.6% expansion) area on the radar.
- Need a break/close above $74.40 (50% expansion) to open up the $76.90 (50% retracement) region, which coincides with the 2018 high ($76.90), with the next area of interest coming in around $78.50 (61.8% expansion) to $78.80 (50% retracement).
Disclosure: See the full disclosure for DailyFX here.


