EUR/NZD: Tracking And Trading The Move Lower
On July 1, 2021, the EUR/NZD pair was demonstrating several bearish patterns which were signaling that the pair would move lower. The pair was stalling at key selling levels, which signaled to traders that sellers/bears were getting in the market.
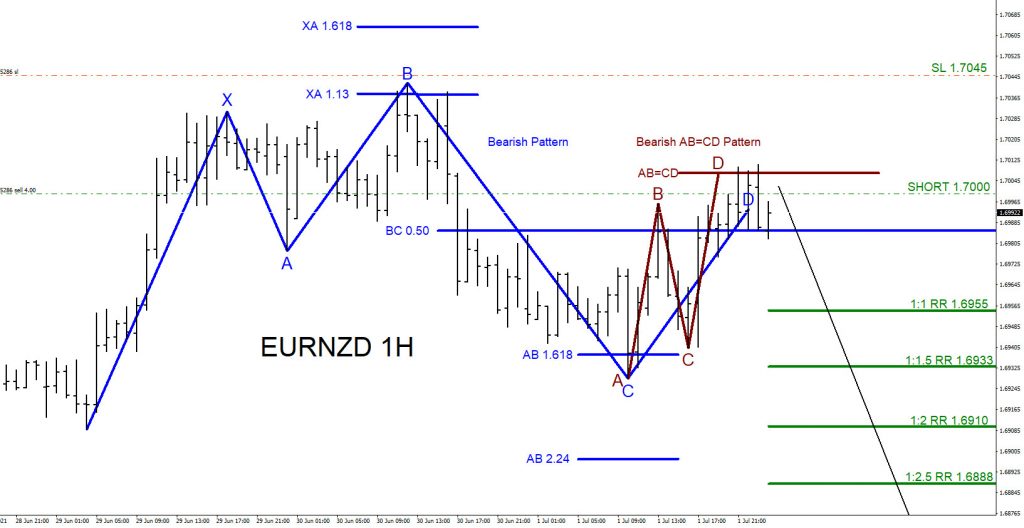
The chart below shows a bearish pattern (blue) completing point D at the BC 0.50% Fib. retracement level. The BC 0.50% Fib. retracement level serves as the sell trigger of the bearish pattern. Another bearish pattern also formed in this area.
An AB=CD bearish pattern (brown) also completed the point D at the AB=CD 1.0% Fib. extension level. The AB=CD 1.0% Fib. extension level is the sell trigger of this pattern. I entered the trade with the aim to sell at 1.7000, with a Stop Loss at 1.7045, and I was looking for a move lower to target the AB 2.24% Fib. retracement level or the 1:2.5 RR target level.
EUR/NZD One-Hour Chart: July 1, 2021
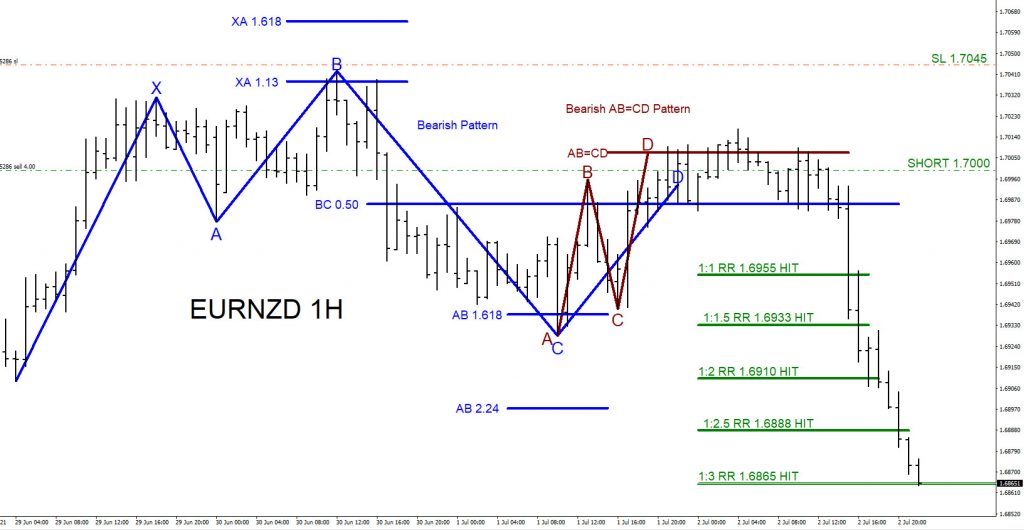
EUR/NZD One-Hour Chart: July 2, 2021
EUR/NZD eventually moved lower, and on July 2, the price extended below the AB 2.24% Fib. retracement level and hit the 1:3 RR target at 1.6865 from the 1.7000 entry for +135 pips.
Disclaimer: Futures, options, and over the counter foreign exchange products may involve substantial risk and may not be suitable for all investors. Leverage can work against you as well as for ...
more


