
Wyckoff’s Second Law Now In Play For Bitcoin And Other Cryptocurrencies On The Daily Chart
(Click on image to enlarge)
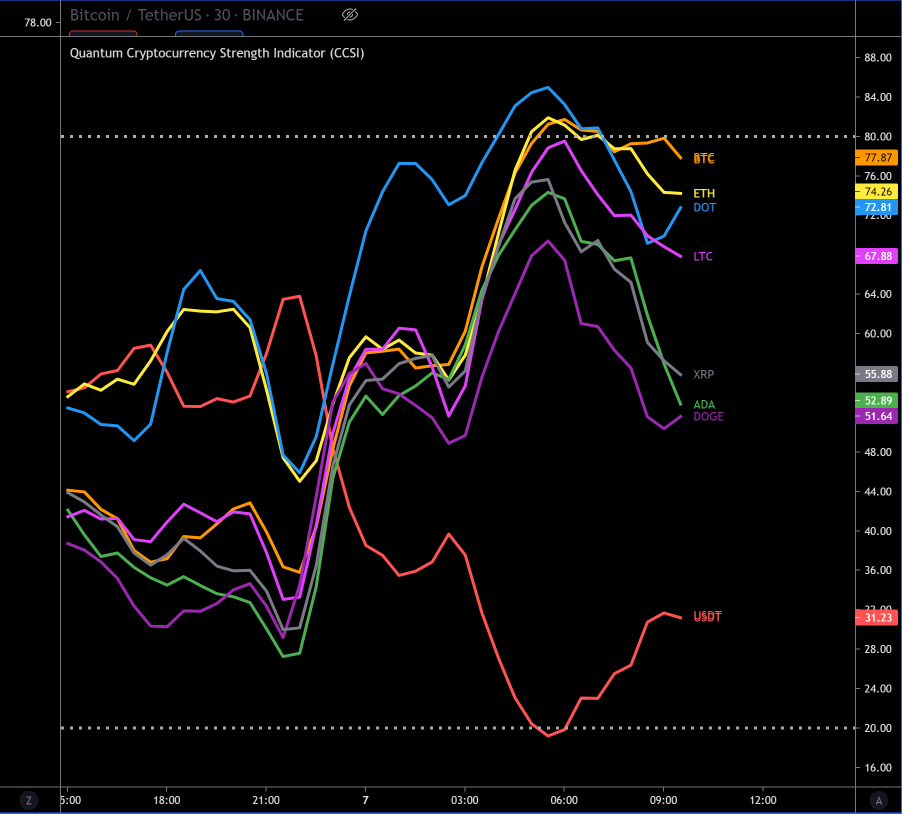
One of the questions I was asked recently following my analysis of Bitcoin on the daily timeframe and the current congestion phases, was whether all the other cryptocurrencies were moving in the same way, and the short answer is yes. To show you this visually alongside is a screenshot of the cryptocurrency strength indicator. This displays eight of the most popular cryptocurrencies including Bitcoin, Ethereum, Litecoin, and Tether. Each of the lines represents one of the cryptocurrencies and all of which are based against the US dollar, which in our case here is Tether, which is the red line. The indicator is also very flexible in that cryptos can be swapped out for any that are on Tradingview. You can find more details about the indicator here – So when Tether is rising the cryptocurrency market falls and when Tether falls, the cryptocurrency market rises en masse. This is one of the major differences between the forex market and the cryptocurrency market. In forex, the currencies all move in different directions and at different speeds. For cryptocurrencies, this is not the case, so the indicator gives an instant visual picture as trends develop against Tether in all timeframes.
(Click on image to enlarge)
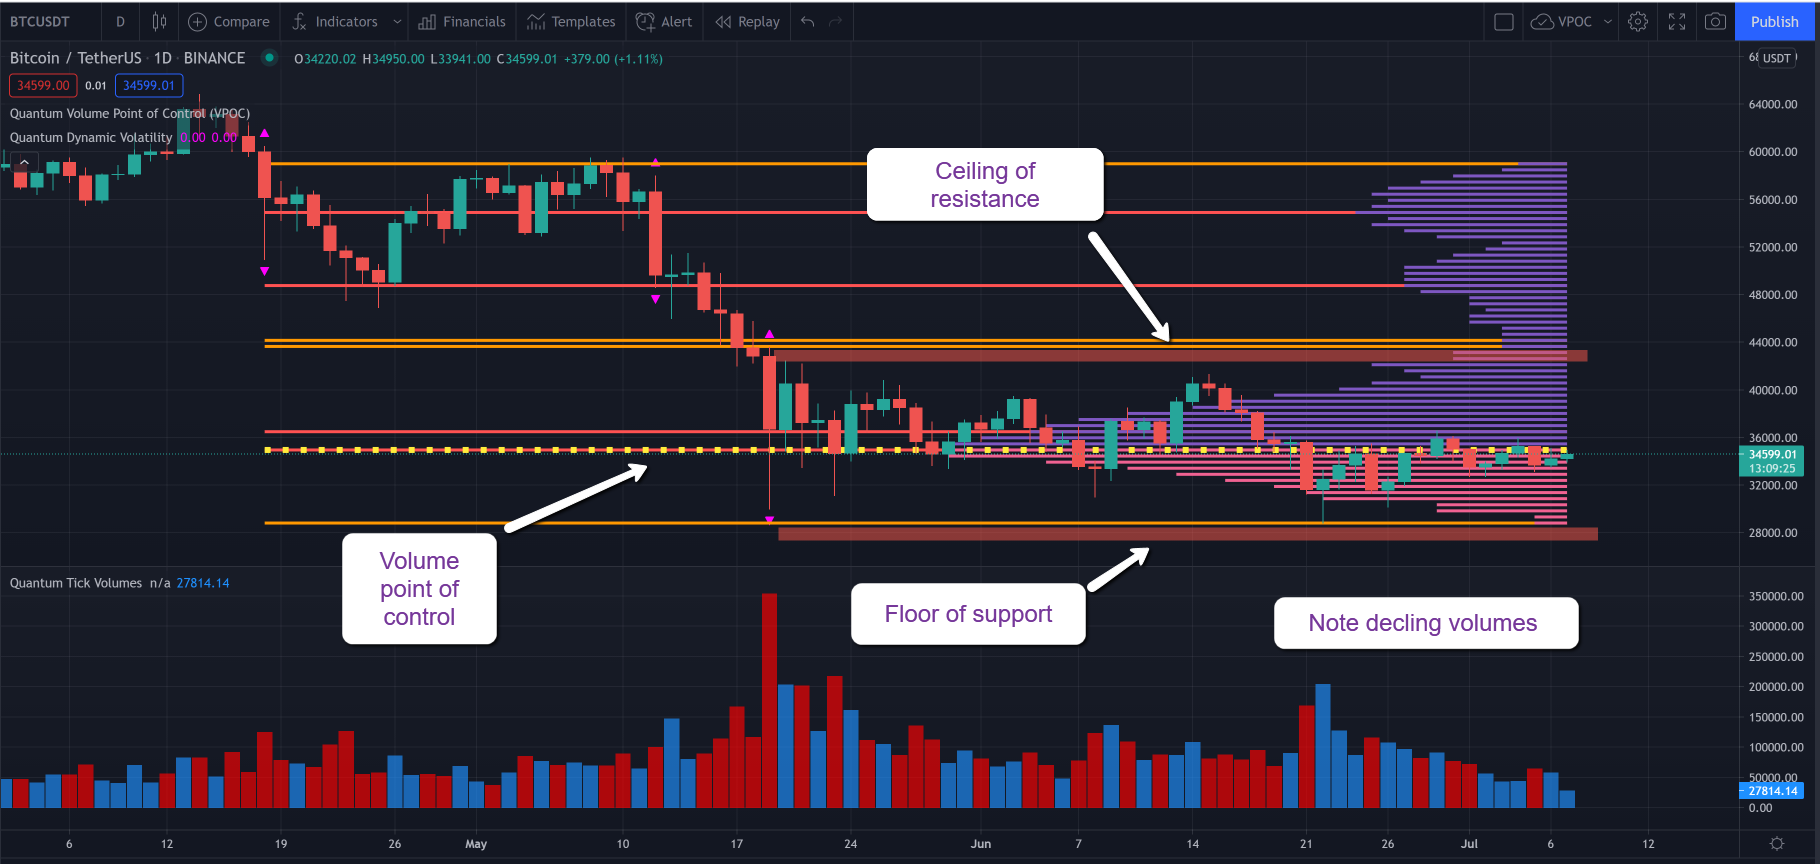
And as we can see on the daily chart for Bitcoin, little has changed since last week in terms of the floor and ceiling of support and resistance range which remain within the spread of the volatility candle of the 19th May. However, what has changed is the intraday volatility which has drained away to virtually nothing with the spread of the candles narrowing, and centered on the volume point of control which is the yellow dashed line on the chart. This is the point at which a price agreement has been reached and there is an equilibrium. This currently sits at $35,000 and confirmed by the deepest volume as shown on the histogram.
This phase of price action and chart pattern is now a classic example of Wyckoff’s second law, namely the law of cause and effect. In other words the greater the cause or the time a market is in congestion, then the greater the effect in the resulting price action which follows. You can think of this as a clockwork toy, the more the spring is wound the tighter it becomes as it stores more energy with every turn. Eventually when it is fully wound and this stored energy is released and the toy travels a great distance. In Bitcoin’s case, the price action is storing up energy to be released in an explosive move as no market can remain rangebound forever. The issue of course is we cannot be 100% certain in which direction and this is where an option strategy could provide a solution, albeit a volatile and expensive one. The option strategy in question is the straddle which is a directionless trade. The strategy pays off regardless of the direction of the breakout, but it’s not that simple, as it is all down to timing. If the market remains rangebound within the period set for the options then premiums are lost. So it requires a volatile move for this approach to work and of course, it’s not always easy to forecast when the break is likely to occur as the options waste away.
Moving to the chart itself if we consider the volume at the bottom, while there has been buying on each reversal lower, the issue is this has not translated into rising volume and rising prices which is the classic effort and result we need to see. In fact, since the 21st of June, the volume has been declining, but then this is in line with the narrowing spreads we are also seeing and may well be a reflection of the summer season when volumes decline naturally.
In summary, when the explosive breakout occurs the levels of interest for the development of the trend are described by the volatility candle of the 19th May with the ceiling at $43,500 and the floor at $28,500. Remember, for the breakout to be valid we need to see it accompanied by strong and rising volume and if so, given the time we have been in congestion, expect the trend to have some momentum and last for some time.
Disclaimer: Futures, stocks, and spot currency trading have large potential rewards, but also large potential risk. You must be aware of the risks and be willing to accept them in order to invest in ...
more

