Join Our Telegram channel to stay up to date on breaking news coverage
Litecoin Price Prediction – June 8
The Litecoin price prediction shows LTC staying under bearish pressure as the crypto market prepares to go lower.
LTC/USD Market
Key Levels:
Resistance levels: $175, $185, $195
Support levels: $95, $85, $75
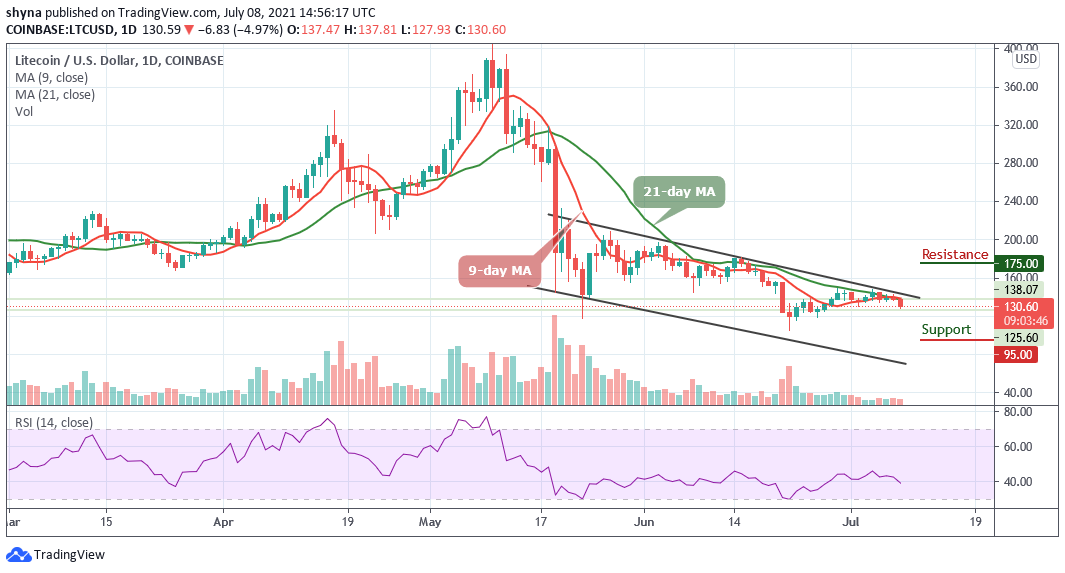
LTC/USD is nursing losses with a sharp drop from the opening price of $137 to touch the low of $127 almost risking breaking into $125 support. However, a sustainable move below the $120 level may confirm the bearish movement for the coin. Moreover, if the Litecoin price failed to climb the 9-day and 21-day moving averages, the downside pressure is likely to increase.
Litecoin Price Prediction: Can Litecoin (LTC) Break Lower?
According to the daily chart, it can be seen that the Litecoin price could not exceed the resistance level of $140 as the coin falls to a support level of $127 today. Meanwhile, the price of Litecoin is supported by a psychological $130. Once this is out of the way, the sell-off is likely to gain traction with the next focus on the recent daily low of $100 after moving towards the lower boundary of the channel. More so, the next bearish target could be located at $95, $85, and $75 support levels.
On the upside, the initial recovery is limited by $140 above the upper boundary of the channel. Traders will need to see a sustainable move above this barrier for the upside to gain traction towards $175, $185, and $195 resistance levels. Meanwhile, the Relative Strength Index (14) shows that the market price may remain at the downside as the signal line moves below 40-level.
Against Bitcoin, the Litecoin price is still moving sideways since the European session as the coin suffers a downtrend pressure from Bitcoin today. Should in case the bulls attempt to gain momentum, bears are likely to keep releasing a huge pressure on the market. At the time of writing, LTC/BTC is trading below the 9-day and 21-day moving averages hovering at 3995 SAT.
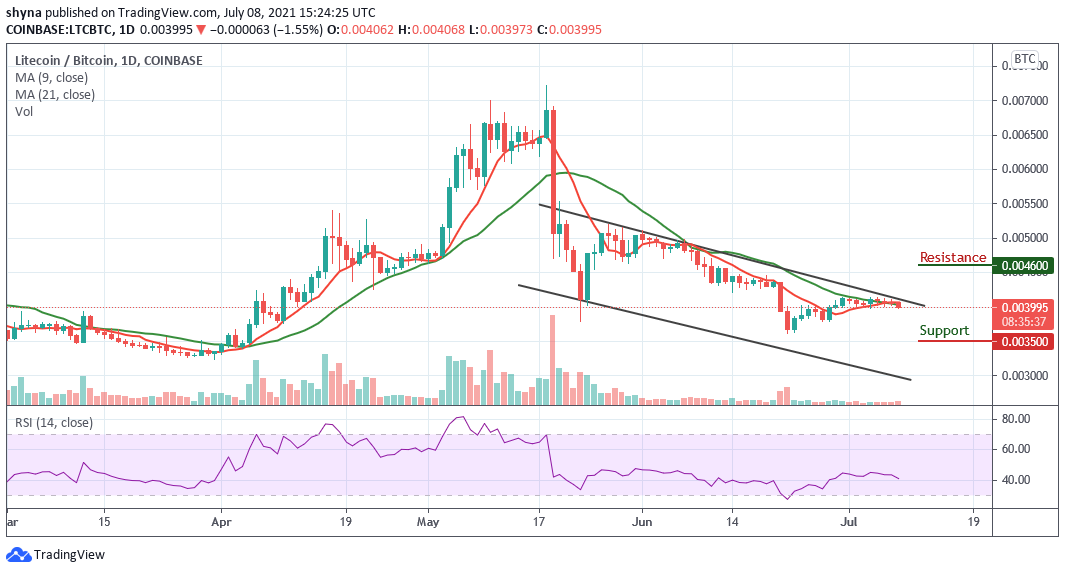
However, the closest resistance level is located at 4600 SAT and above while the nearest support level is 3500 SAT. Below this, additional supports could be found at 3300 SAT and 3100 SAT. In addition, the Relative Strength Index (4) is likely to cross below 40-level giving a bearish signal.
Looking to buy or trade Litecoin (LTC) now? Invest at eToro!
75% of retail investor accounts lose money when trading CFDs with this provider
Join Our Telegram channel to stay up to date on breaking news coverage