
Advertisement
Advertisement
Ethereum, Litecoin, and Ripple’s XRP – Daily Tech Analysis – July 14th, 2021
By:
It's been a bearish start to the week. Failure to move through the day's pivot levels will yield more losses on the day...

Ethereum
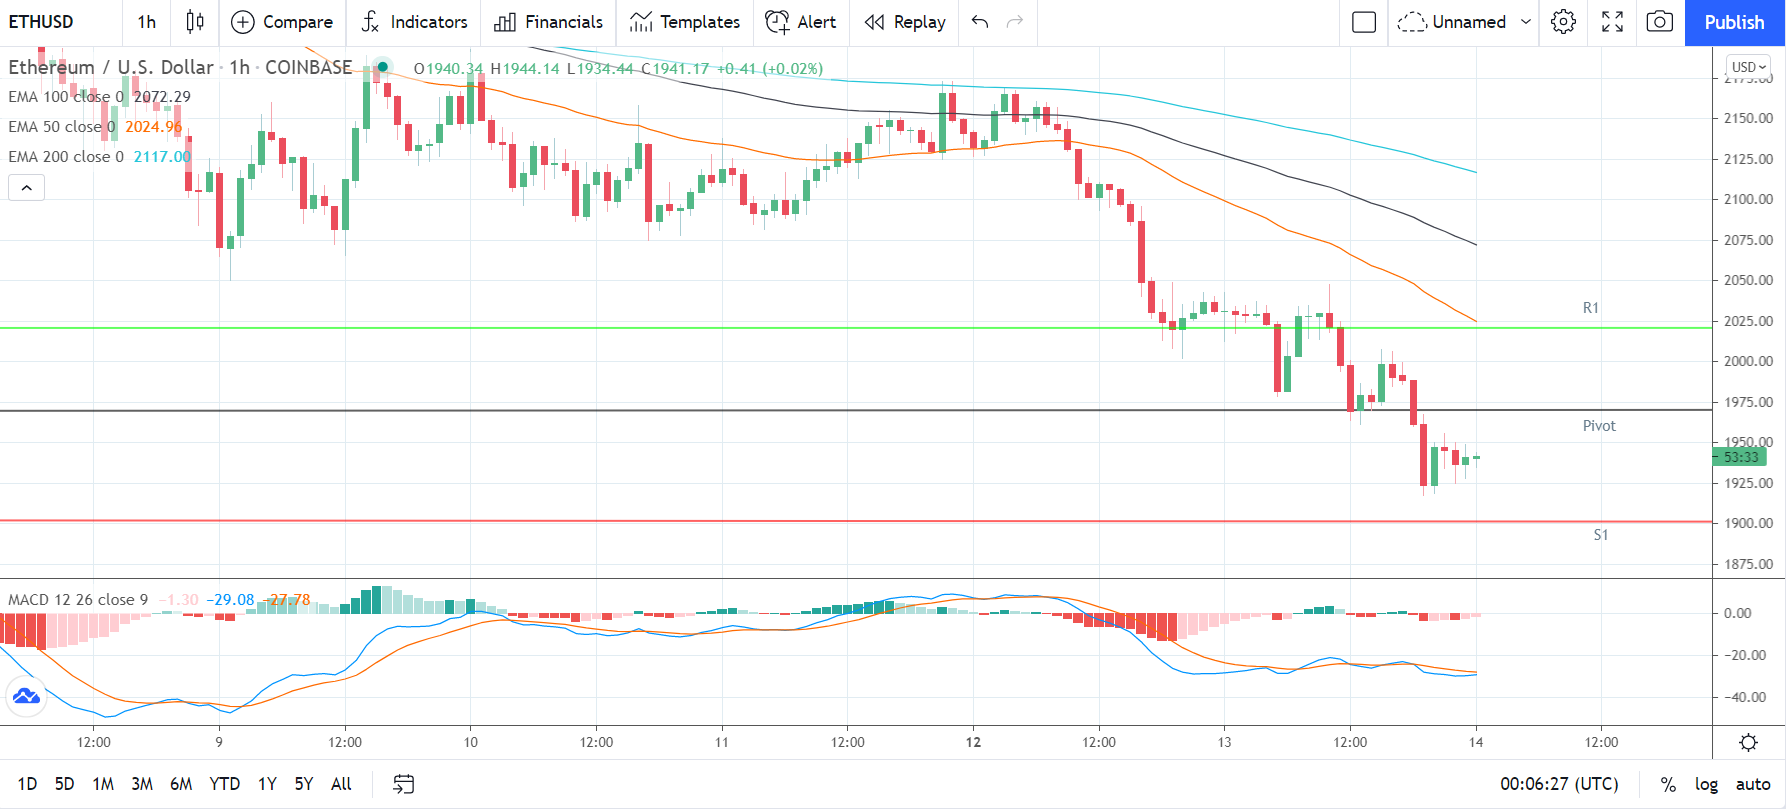
Ethereum fell by 4.43% on Tuesday. Following a 5.17% slide on Monday, Ethereum ended the day at $1,940.76.
A mixed start to the day saw Ethereum rise to a late morning intraday high $2,047.72 before hitting reverse.
Falling short of the first major resistance level at $2,133, Ethereum slid to a late intraday low $1,917.40.
Ethereum fell through the first major support level at $1,966 to end the day at sub-$1,950 levels.
At the time of writing, Ethereum was up by 0.02% to $1,941.17. A mixed start to the day saw Ethereum fall to an early morning low $1,934.44 before rising to a high $1,944.14.
Ethereum left the major support and resistance levels untested early on.
For the day ahead
Ethereum would need to move through the $1,969 pivot to bring the first major resistance level at $2,020 into play.
Support from the broader market would be needed, however, for Ethereum to break back through to $2,000 levels.
Barring an extended crypto rally, the first major resistance level and Tuesday’s high $2,047.72 would likely cap any upside.
In the event of a broad-based crypto rally, Ethereum could test the second major resistance level at $2,099.
Failure to move through the $1,969 pivot would bring the first major support level at $1,900 into play.
Barring an extended sell-off, however, Ethereum should steer clear of sub-$1,800 levels. The second major support level at $1,838 should limit the downside.
Looking at the Technical Indicators
First Major Support Level: $1,900
Pivot Level: $1,969
First Major Resistance Level: $2,020
23.6% FIB Retracement Level: $3,369
38.2% FIB Retracement Level: $2,740
62% FIB Retracement Level: $1,725
Litecoin
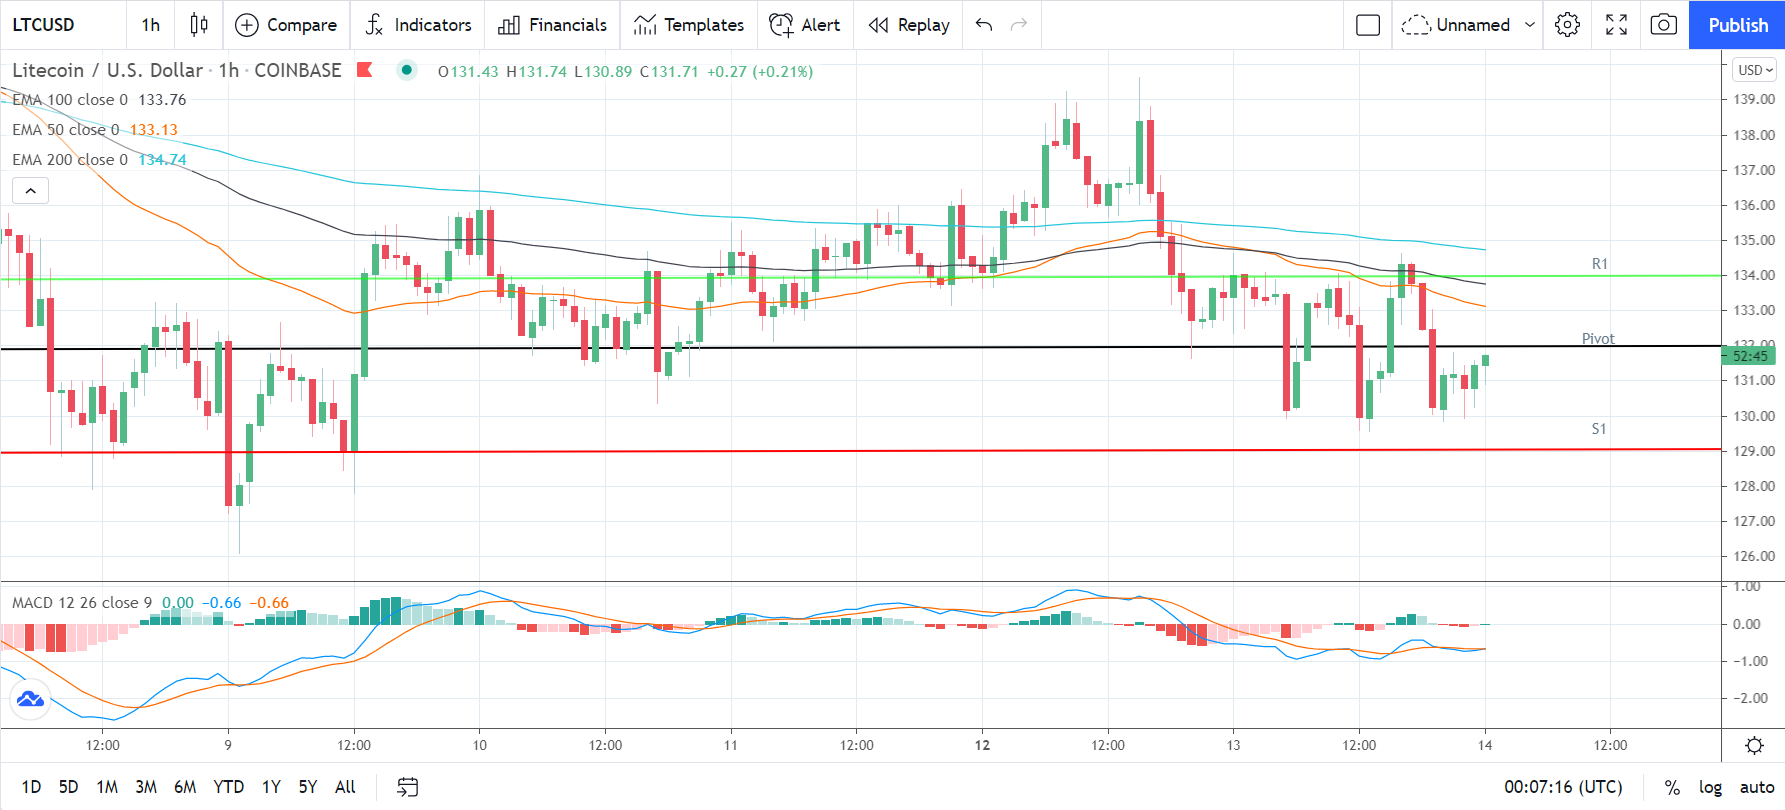
Litecoin fell by 1.45% on Tuesday. Following a 0.69% loss on Monday, Litecoin ended the day at $131.44.
In a mixed start to the day saw Litecoin rise to an early morning intraday high $134.62 before hitting reverse.
Falling short of the first major resistance level at $138, Litecoin slid to a midday intraday low $129.56.
Litecoin briefly fell through the first major support level at $130 before revisiting $134 levels.
A bearish end to the day, however, saw Litecoin fall back to end the day at $131 levels.
At the time of writing, Litecoin was up by 0.21% to $131.71. A mixed start to the day saw Litecoin fall to an early morning low $130.89 before rising to a high $131.74.
Litecoin left the major support and resistance levels untested early on.
For the day ahead
Litecoin would need to move through the $132 pivot to bring the first major resistance level at $134 into play.
Support from the broader market would be needed, however, for Litecoin to break out from $134 levels.
Barring an extended crypto rally, the first major resistance level and Tuesday’s high $134.62 would likely cap any upside.
In the event of an extended breakout, Litecoin could test resistance at $140. The second major resistance level sits at $137.
Failure to move through the $132 pivot would bring the first major support level at $129 into play.
Barring another extended sell-off, however, Litecoin should steer clear of the second major support level at $127.
Looking at the Technical Indicators
First Major Support Level: $129
Pivot Level: $132
First Major Resistance Level: $134
23.6% FIB Retracement Level: $178
38.2% FIB Retracement Level: $223
62% FIB Retracement Level: $296
Ripple’s XRP
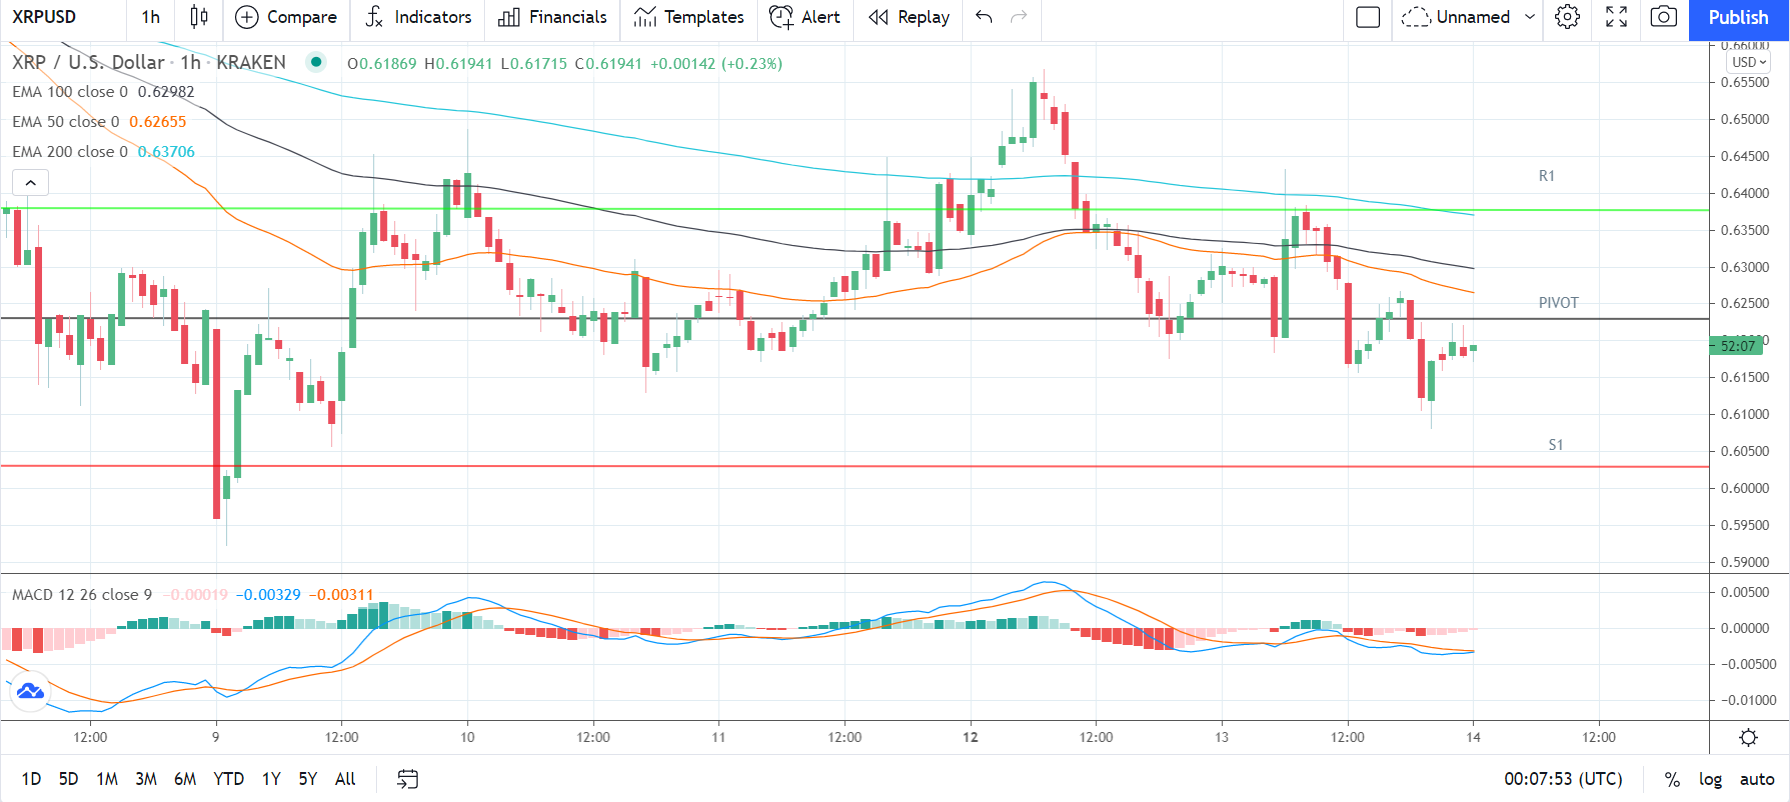
Ripple’s XRP fell by 1.76% on Tuesday. Following a 0.80% decline on Monday, Ripple’s XRP ended the day at $0.61799.
A mixed start to the day saw Ripple’s XRP rally to a mid-morning intraday high $0.64317 before hitting reverse.
Falling short of the first major resistance level at $0.6516, Ripple’s XRP slid to a late intraday low $0.60814.
Ripple’s XRP briefly fell through the first major support level at $0.6124 before a revisiting $0.619 levels. A bearish end to the day, however, left Ripple’s XRP at $0.617 levels.
At the time of writing, Ripple’s XRP was up by 0.23% to $0.61941. A mixed start to the day saw Ripple’s XRP fall to an early morning low $0.61715 before rising to a high $0.61941.
Ripple’s XRP left the major support and resistance levels untested early on.
For the day ahead
Ripple’s XRP will need to move through the $0.6231 pivot to bring the first major resistance level at $0.6381 into play.
Support from the broader market would be needed, however, for Ripple’s XRP to break back through to $0.63 levels.
Barring an extended crypto rally, the first major resistance level and Tuesday’s high $0.64317 would likely cap any upside.
In the event of another breakout, Ripple’s XRP could test the second major resistance level at $0.6581.
Failure to move through the $0.6231 pivot would bring the first major support level at $0.6030 into play.
Barring another extended sell-off, however, Ripple’s XRP should steer clear of the second major support level at $0.5881.
Looking at the Technical Indicators
First Major Support Level: $0.6030
Pivot Level: $0.6231
First Major resistance Level: $0.6381
23.6% FIB Retracement Level: $0.8533
38.2% FIB Retracement Level: $1.0659
62% FIB Retracement Level: $1.4096
Please let us know what you think in the comments below.
Thanks, Bob
About the Author
Bob Masonauthor
With over 20 years of experience in the finance industry, Bob has been managing regional teams across Europe and Asia and focusing on analytics across both corporate and financial institutions. Currently he is covering developments relating to the financial markets, including currencies, commodities, alternative asset classes, and global equities.
Did you find this article useful?
Latest news and analysis


Advertisement