Join Our Telegram channel to stay up to date on breaking news coverage
Ripple Price Prediction – July 21
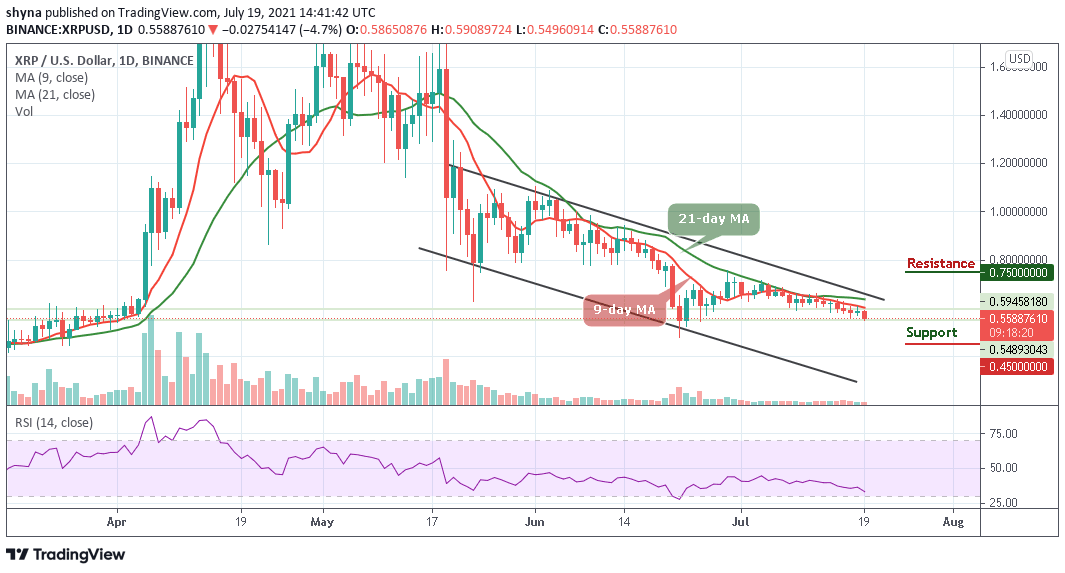
The Ripple price improves as the coin now faces an intraday zone between $0.52 and $0.58.
XRP/USD Market
Key Levels:
Resistance levels: $0.70, 0.80, $0.90
Support levels: $0.40, $0.30, $0.20
XRP/USD struggles to settle above the 9-day moving average amid global recovery on the cryptocurrency market.
The seventh-largest digital asset has gained nearly 8.8% in the last 24 hours and touched the intraday high at $0.58 before retreating slightly to $0.57.
At the time of writing, the Ripple price is warming up to cross above the 9-day and 21-day moving averages, as the technical indicator Relative Strength Index (14) moves to cross above 38-level.
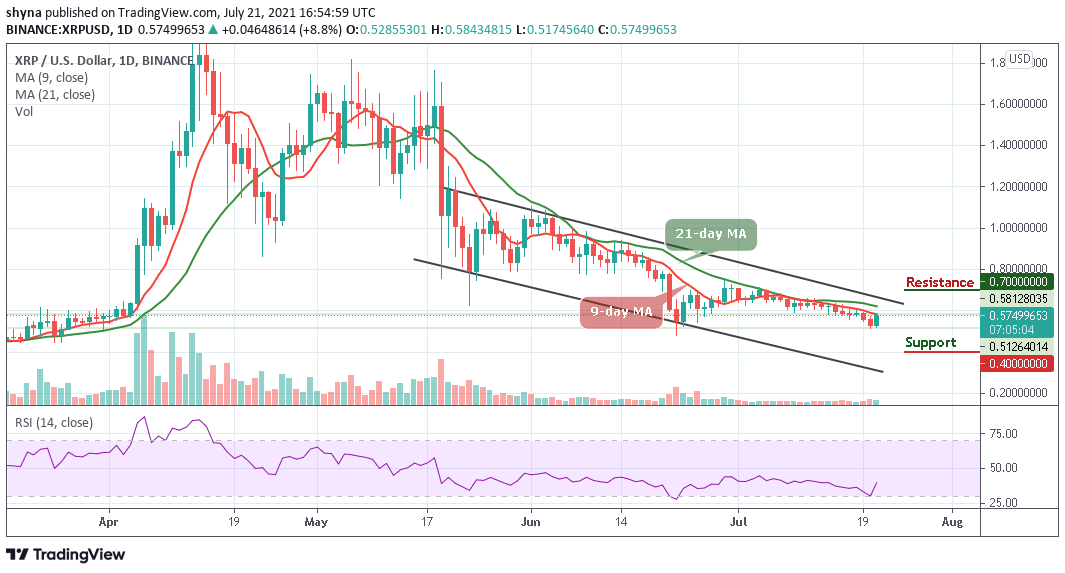
Ripple Price Prediction: Can Ripple Break Above the Moving Averages?
Looking at the daily chart above, the red-line of 9-day MA is still below the green-line of 21-day MA as it continues its downward movement.
However, a breakdown below the opening price of $0.52 could dictate the direction in which the Ripple price may head to.
Moreover, if the Ripple price collapses beneath this level, it may turn bearish. However, a break above the 9-day and 21-day MAs could push the coin back on the bullish footing.
Meanwhile, XRP/USD needs to break the current range for it to break out of the neutral trading condition.
Therefore, if buyers can keep the movement above the upper boundary of the channel, the first level of resistance at $0.65 level could be reached.
Further bullish movement may hit the potential resistance at $0.70, $0.80, and $0.90 levels.
On the downside, the support at $0.50 should be able to hold the current movement.
If the market pushes beneath, the market may turn bearish and further support levels are located at $0.40, $0.30, and $0.20.
Against Bitcoin, the Ripple price is still below the 9-day and 21-day moving averages. Meanwhile, the price action has remained bearish and if the selling pressure increases, XRP/BTC price variation may create a new monthly low.
At the moment, the technical indicator Relative Strength Index (14) remains beneath; traders may see a sideways movement within a short time.
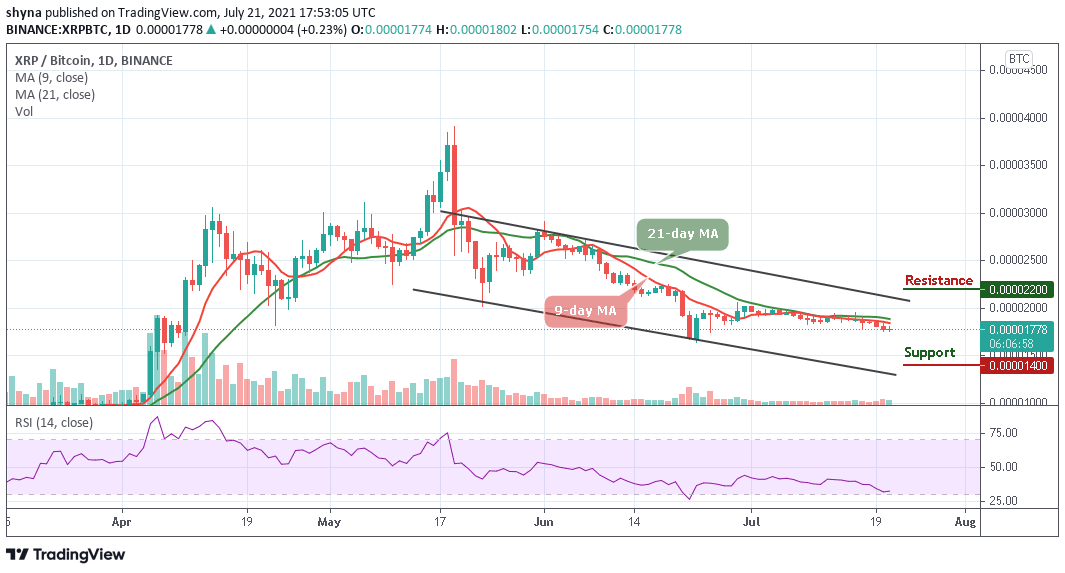
However, Ripple is currently trading at 1778 SAT, which is below the moving averages.
Traders can expect close support at 1600 SAT before breaking through 1400 SAT and 1200 SAT.
In the event that an upward movement occurs and a breakout above the 9-day and 21-day moving averages is validated, we could see a confirmation of an upward move for the market, and the next resistance levels to be reached would be at 2200 SAT and 2400 SAT.
Looking to buy or trade Ripple (XRP) now? Invest at eToro!
75% of retail investor accounts lose money when trading CFDs with this provider
Join Our Telegram channel to stay up to date on breaking news coverage