
Gold Weekly Forecast: Bulls Struggling Around 1800 Ahead Of Fed Decision

Photo by Dmitry Demidko on Unsplash
Gold Weekly Forecast Highlights
- US reports show home sales increase by 1.4% every month.
- The UoM (University of Michigan’s) initial Consumer Sentiment Index for July demonstrates a negative shift in consumer sentiment and a sharp rise in inflation expectation.
- The technical outlook of gold remains neutral with a bearish bias, as the price remains near the low limit of the weekly consolidation channel.
The gold weekly forecast is slightly bearish as bulls struggle to hold beyond the 1800 mark. On Tuesday, after rising above 1,820, gold turned south in the second half of the week, but tackled to close the week a little above the key 100-day SMA, which is located at the 1,796 level.
What Happened to Gold Last Week?
Lacking high-tier macroeconomic data releases and basic developments, risk perception remains the primary market mover in the last week. However, the sharp turn down witnessed in Wall Street’s main indexes on Monday and Tuesday allowed the greenback to find demand. Somehow, gold also capitalized on the risk-off flows, indicating that precious metal is looking to get back its safe-haven status.
On Thursday, the US department of labor published a report of 419,000 claims for unemployment benefits in the US during this week by the end of July 17. The figure was worse than the market expectations of 350,000, but was largely avoided by the market participants. On the other hand, the US illustrated that existing home sales rose by 1.4% every month, while the national median home price for the existing homes rose by 23.4% from June 2020 to 363,000.
What’s Next to Watch for Gold?
The economic calendar shows that next week will be a little bit busy. On Tuesday, the Durable Goods data will be released along with the Conference Board (CB) consumer confidence index. In addition, the UoM (University of Michigan’s) initial Consumer Sentiment Index for July demonstrates a negative shift in consumer sentiment and a sharp rise in inflation expectation.
A similar picture in the CB report is likely to provide bids for the greenback. Furthermore, the Fed’s interest rate decision and statement can trigger volatility in gold.

![]()
Gold Weekly Technical Analysis: Bears to Press Further
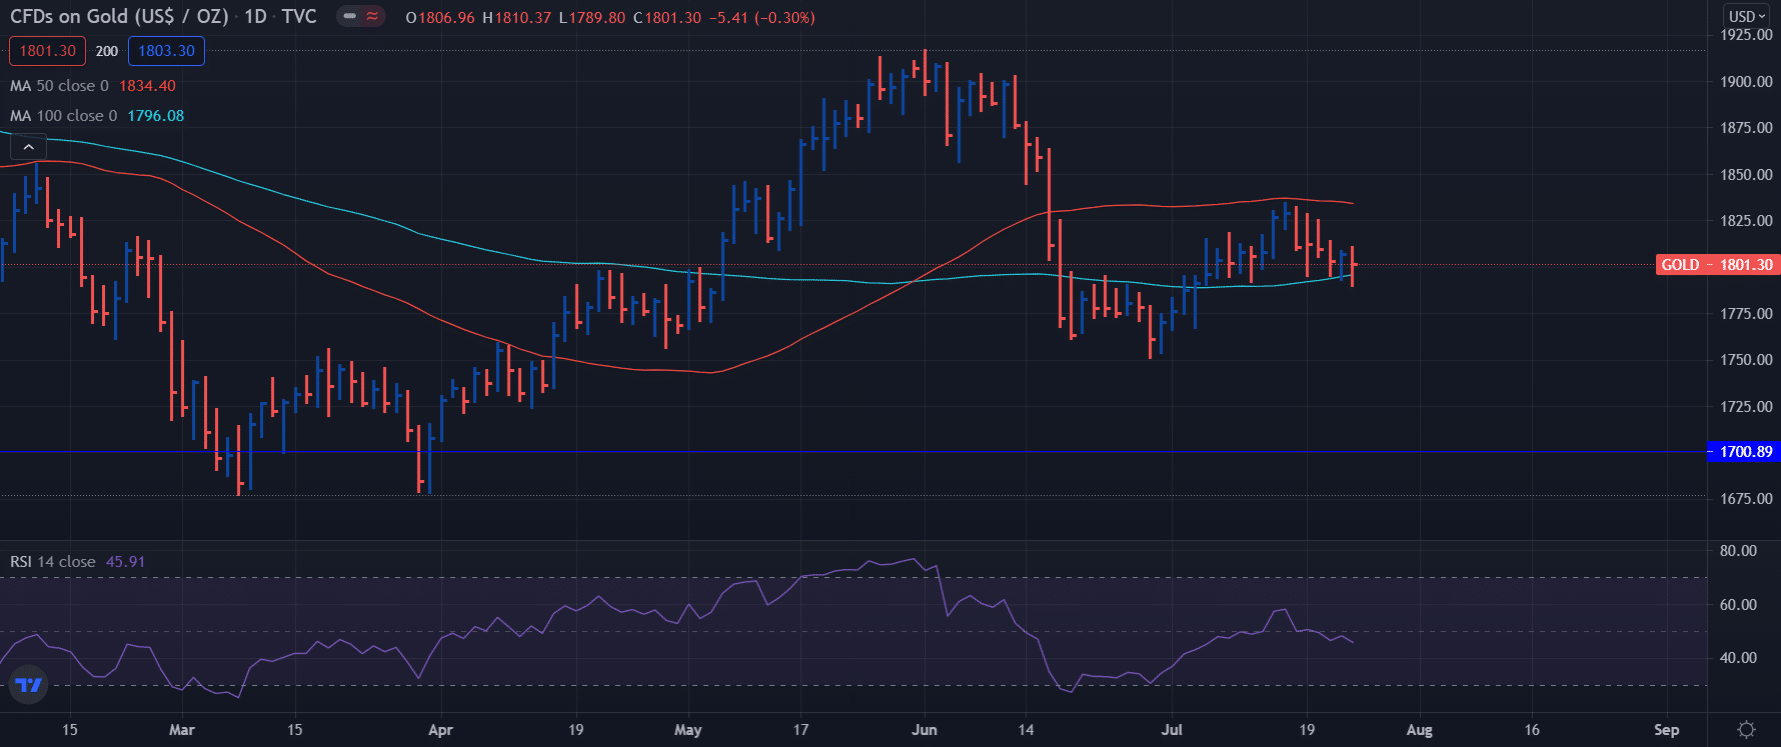
The technical outlook of gold remains neutral with a bearish bias, as the price remains near the lower limit of the weekly consolidation channel. Besides RSI (Relative Strength Index), indicators on the daily chart fall back below 50, recommending that buyers try to remain in control.
Nevertheless, sellers could hold up for the XAU/USD pair to make a daily close below 1796 (100-day SMA) before looking to incline the bearish pressure. Below that level, 1790 lines up as support ahead of 1775.
On the other hand, the 200-SMA seems to have established a tough resistance in 1820. If buyers increase the price above the resistance level, the 1830 and 1835 (50-day SMA) levels might be targeted next.
Gold Weekly Forecast - Daily Chart
Disclaimer: Foreign exchange (Forex) trading carries a high level of risk and may not be suitable for all investors. The risk grows as the leverage is higher. Investment objectives, risk ...
more

