
Advertisement
Advertisement
EOS, Stellar’s Lumen, and Tron’s TRX – Daily Analysis – July 26th, 2021
By:
It's a particularly bullish start to the week for the majors. A move back through early highs would support an extended rally on the day.

In this article:
EOS
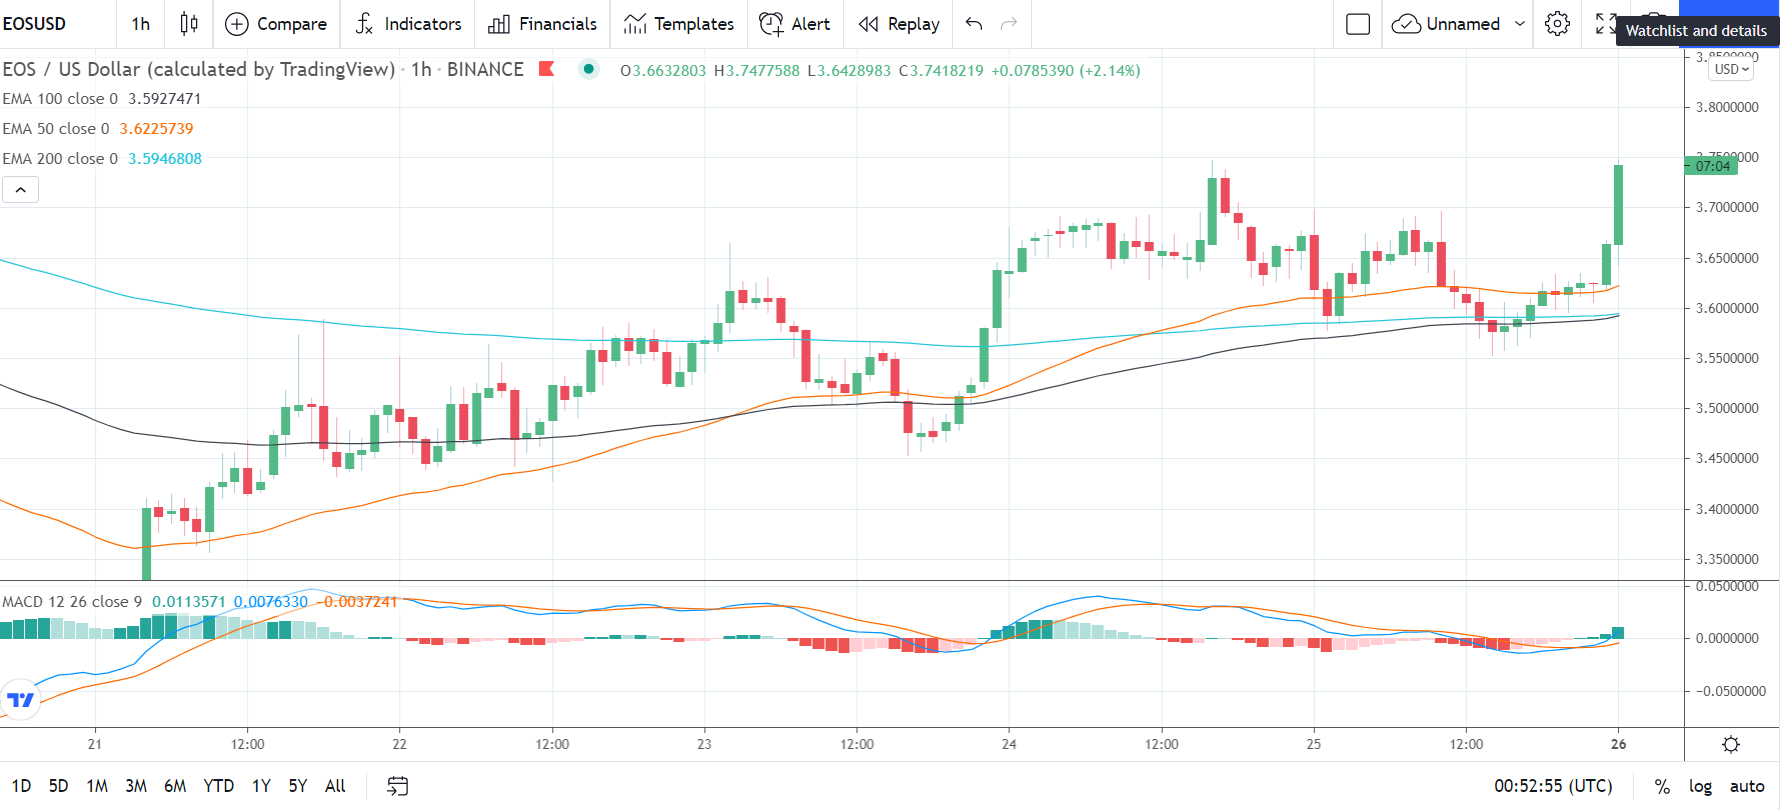
EOS slipped by 0.25% on Sunday. Partially reversing a 0.95% gain from Saturday, EOS ended the week up by 0.75% to $3.6633.
A mixed start to the day saw EOS rise to an early morning intraday high $3.6982 before hitting reverse.
Falling short of the first major resistance level at $3.7417, EOS fell to an early afternoon intraday low $3.5526.
EOS fell through the first major support level at $3.6060 before a partial recovery to $3.66 levels.
At the time of writing, EOS was up by 2.14% to $3.7418. A mixed start to the day saw EOS fall to an early morning low $3.6429 before rising to a high $3.7478.
EOS broke through the first major resistance level at $3.7235 early on.
For the day ahead
EOS would need to avoid a fall back through the first major resistance level at $3.7235 to bring $3.80 levels into play.
Support from the broader market would be needed for EOS to out from the second major resistance level at $3.7836.
Barring an extended crypto rally, the second major resistance level and resistance at $3.80 would likely cap any upside.
In the event of an extended rally, EOS could test the third major resistance level sits at $3.9292.
A fall back through the first major resistance level and through the $3.6380 pivot would bring the first major support level at $3.5779 into play.
Barring another extended sell-off, however, EOS should steer clear of sub-$3.50 levels. The second major support level sits at $3.4924.
Looking at the Technical Indicators
First Major Support Level: $3.5779
First Major resistance Level: 3.7235
23.6% FIB Retracement Level: $6.52
38% FIB Retracement Level: $9.68
62% FIB Retracement Level: $14.77
Stellar’s Lumen
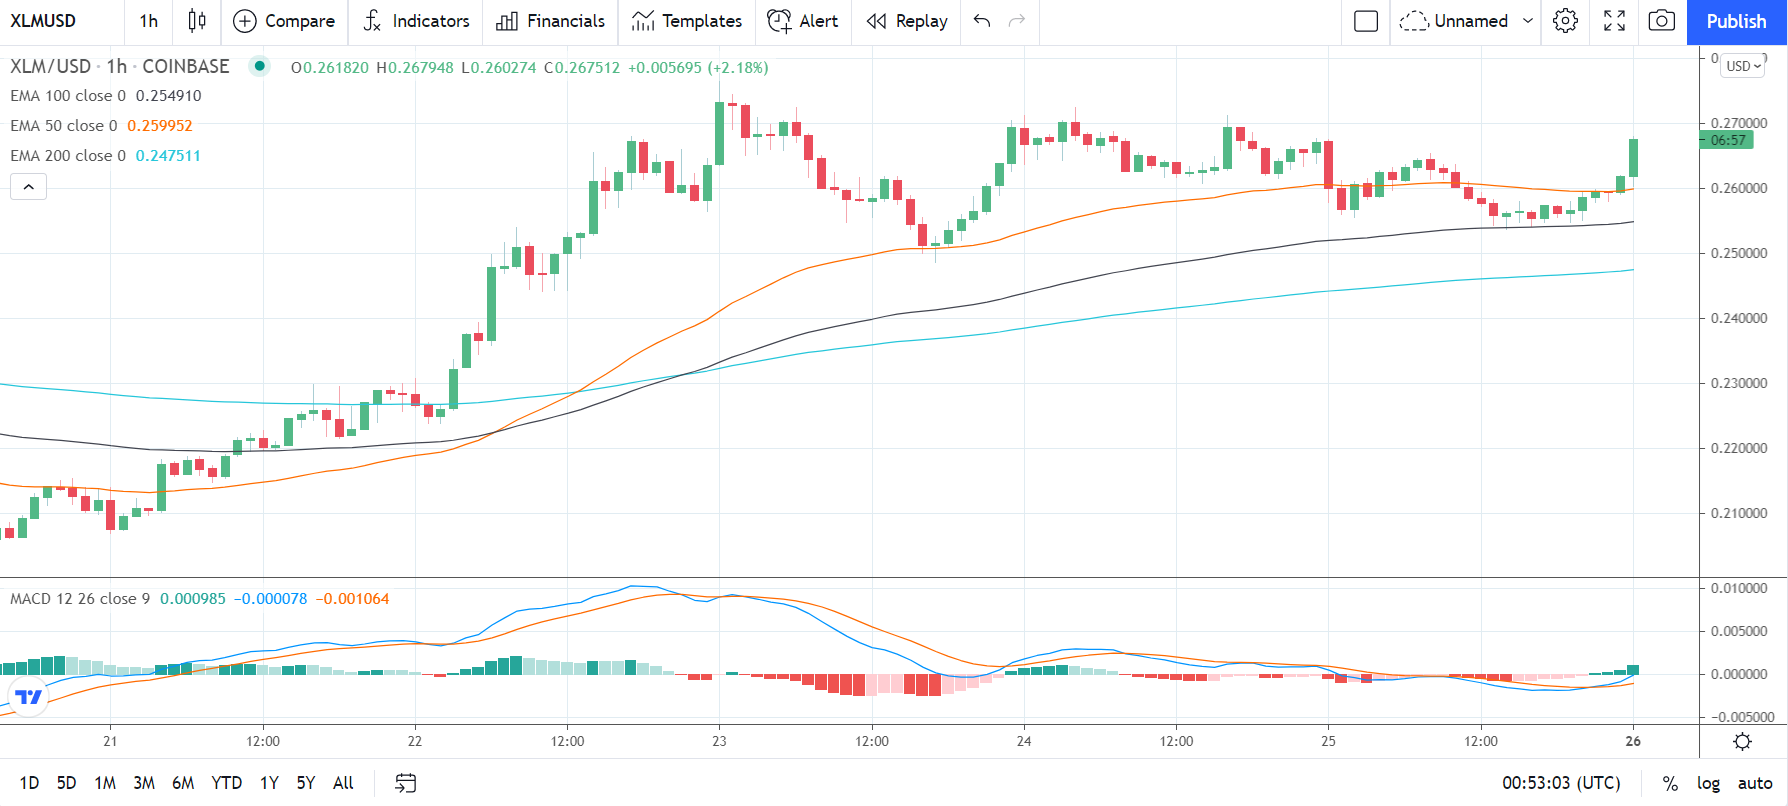
Stellar’s Lumen fell by 2.02% on Sunday. Following a 0.82% loss on Saturday, Stellar’s Lumen ended the week up by 13.94% to $0.2618.
A mixed start saw Stellar’s Lumen rise to an early morning intraday high $0.2676 before hitting reverse.
Falling short of the first major resistance level at $0.2728, Stellar’s Lumen fell to an early afternoon intraday low $0.2537.
Stellar’s Lumen fell through the first major support level at $0.2611 and the second major support level at $0.2551.
Finding late support, however, Stellar’s Lumen moved back through the major support levels to end the day at $0.2618 levels.
At the time of writing, Stellar’s Lumen was up by 2.18% to $0.2675. A mixed start to the day saw Stellar’s Lumen fall to an early morning low $0.2603 before rising to a high $0.2680.
Stellar’s Lumen left the major support and resistance levels untested early on.
For the day ahead
Stellar’s Lumen would need to avoid the $0.2610 pivot to bring the first major resistance level at $0.2684 back into play.
Support from the broader market would be needed, however, for Stellar’s Lumen to break out from this morning’s high $0.2680.
Barring an extended rally, the first major resistance level and resistance at $0.27 would likely cap any upside.
In the event of a broad-based crypto rally, Stellar’s Lumen could test resistance at $0.2850 before any pullback. The second major resistance level sits at $0.2749.
A fall through the $0.2610 pivot would bring the first major support level at $0.2545 into play.
Barring another extended sell-off on the day, Stellar’s Lumen should steer clear of sub-$0.25 levels. The second major support level sits at $0.2471.
Looking at the Technical Indicators
First Major Support Level: $0.2545
First Major Resistance Level: $0.2684
23.6% FIB Retracement Level: $0.3402
38% FIB Retracement Level: $0.4277
62% FIB Retracement Level: $0.5690
Tron’s TRX
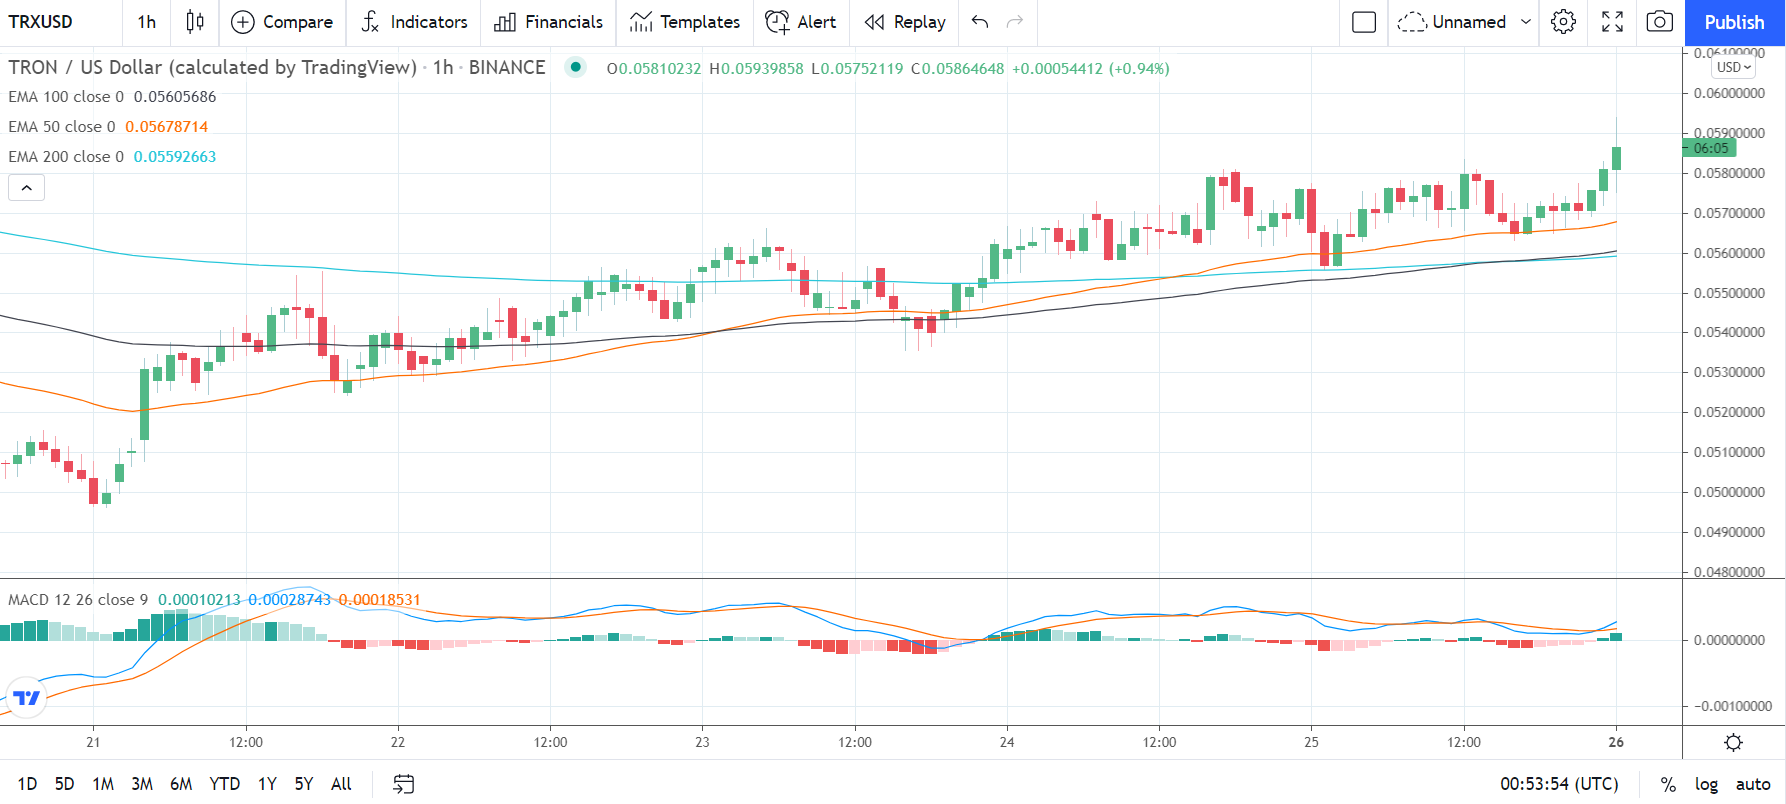
Tron’s TRX rose by 0.85% on Sunday. Following a 2.49% gain on Saturday, Tron’s TRX ended the week up by 3.87% to $0.05810.
A bearish start to the day saw Tron’s TRX fall to an early morning intraday low $0.05560 before making a move.
Tron’s TRX fell through the first major support level at $0.05603 before rising to a mid-day intraday high $0.05835.
Falling short of the first major resistance level at $0.05863, however, Tron’s TRX fell back to $0.056 levels and into the red.
Finding late support, Tron’s TRX moved back through to $0.058 levels to end the day in positive territory.
At the time of writing, Tron’s TRX was up by 0.94% to $0.05865. A mixed start to the day saw Tron’s TRX fall to an early morning low $0.05752 before rising to a high $0.05940.
Tron’s TRX broke through the first major resistance level at $0.05910 early on.
For the Day Ahead
Tron’s TRX would need to avoid a fall through the $0.05735 pivot to bring the first major resistance level at $0.05910 back into play.
Support from the broader market would be needed, however, for Tron’s TRX to move back through to $0.0590 levels.
Barring an extended crypto rally, the first major resistance level would likely cap any upside.
In the event of an extended rally, Tron’s TRX could test resistance at $0.062 levels. The second major resistance level sits at $0.06010.
A fall through the $0.05735 pivot would bring the first major support level at $0.05635 into play.
Barring another extended sell-off, however, Tron’s TRX should steer clear of the second major support level at $0.05460.
Looking at the Technical Indicators
First Major Support Level: $0.05635
First Major Resistance Level: $0.05910
23.6% FIB Retracement Level: $0.0787
38.2% FIB Retracement Level: $0.0989
62% FIB Retracement Level: $0.1316
Please let us know what you think in the comments below
Thanks, Bob
About the Author
Bob Masonauthor
With over 20 years of experience in the finance industry, Bob has been managing regional teams across Europe and Asia and focusing on analytics across both corporate and financial institutions. Currently he is covering developments relating to the financial markets, including currencies, commodities, alternative asset classes, and global equities.
Did you find this article useful?
Latest news and analysis


Advertisement