Join Our Telegram channel to stay up to date on breaking news coverage
Bitcoin Cash Price Prediction – July 25
The Bitcoin Cash’s sudden dip is below $450 as the coin may be entering deeply into the negative side.
BCH/USD Market
Key Levels:
Resistance levels: $600, $650, $700
Support levels: $300, $250, $200
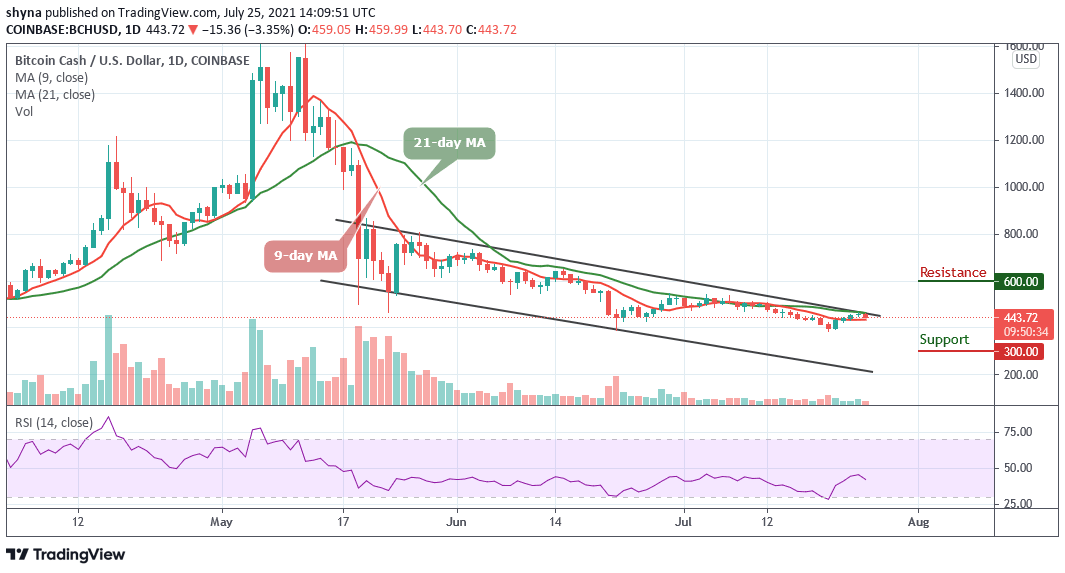
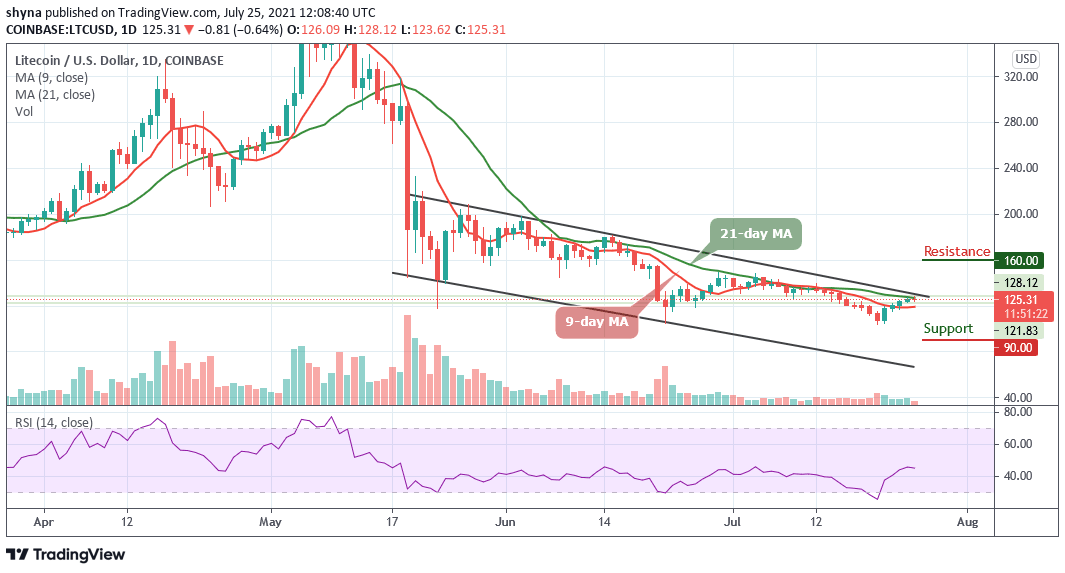
BCH/USD is still following a downtrend as bears now move to dominate the entire cryptocurrency landscape. Presently, the Bitcoin Cash price is hovering within the 9-day and 21-day moving averages as the trend has a bearish inclination, which may likely touch the support at $400. However, the technical indicator still remained bearish as the Relative Strength Index (14) may dip below 40-level.
Bitcoin Cash Price Prediction: BCH Price Could Spike Below $400
As the daily chart reveals, the Bitcoin Cash price is likely to cross below the 9-day moving average and the best bulls can do is to defend the support at $400 and focus on pulling towards $500. A few days ago, the coin has been following an upward movement but the sharp drop today is affecting the buyers from an attempted recovery above $460.
However, should in case the buying pressure increases, the price may break above the upper boundary of the channel to reach the resistance at $500. However, trading at that level could push the coin towards the resistance levels of $600, $650, and $700 respectively.
On the contrary, if the coin decides to follow the negative side, a minimum swing below the 9-day moving average could bring the price to a $350 level. Exceeding this level could take the bears to $300, $250, and $200 levels by moving towards the lower boundary of the channel.
When compares with Bitcoin, the daily chart reveals that bears continue to push the price towards the south. The daily chart reveals that the trend may continue to follow the downtrend as buyers were unable to push the price above 9-day and 21-day moving averages.
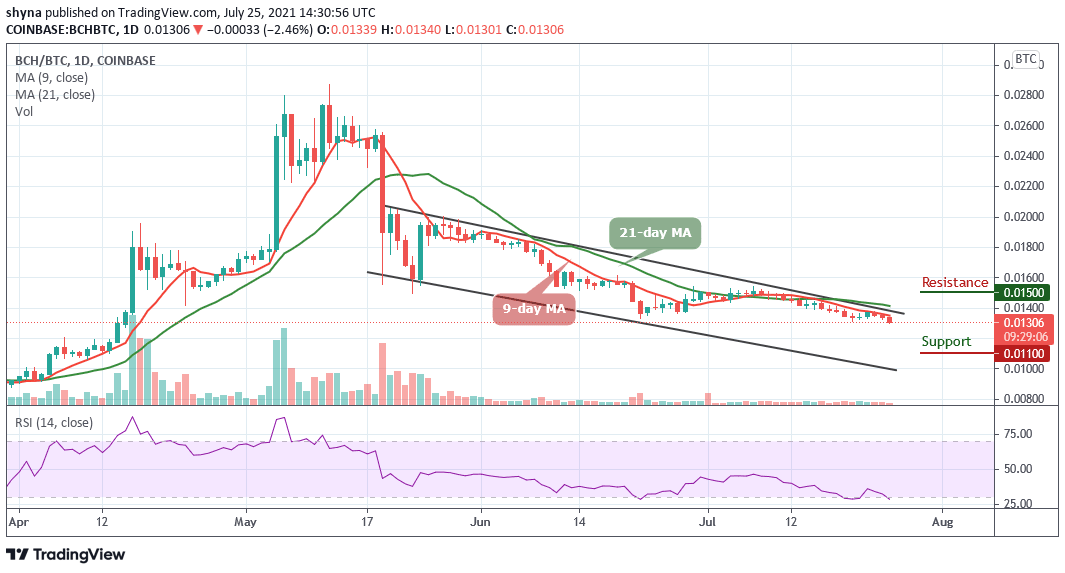
However, as the technical indicator Relative Strength Index (14) slides below the 30-level, it is likely to cross into the oversold region and a bearish continuation could lower the price to the support level of 1100 SAT and below, but once it crosses above the upper boundary of the channel, the market price may likely begin an upward trend which could push the coin towards the resistance level of 1500 SAT and above.
Looking to buy or trade Bitcoin Cash (BCH) now? Invest at eToro!
75% of retail investor accounts lose money when trading CFDs with this provider
Join Our Telegram channel to stay up to date on breaking news coverage