
USD/CAD Price Forecast: Risk Events To Dominate The Week Ahead
HAWKISH VS DOVISH: BANK OF CANADA LEADS THE RACE TOWARD EVENTUAL INTEREST RATE HIKES
BoC more hawkish than FOMC
In July, the BoC left rates unchanged but decided to reduce weekly asset purchases by C$1 billion to C$2 billion a week. The bank had already started tapering back in April as a result of much improved economic conditions and foresees a continuation of improved conditions via its stronger outlook for the US economy – major importer of Canadian goods.
However, the third wave of the virus slowed economic growth somewhat in Q2 resulting in the Bank forecasting a slightly lower GDP figure for 2021 at 6%, 4.5% next year and increased the 2023 outlook by a quarter of a percent to 3.25%.
The FOMC however, has remained consistent in that it would support the economy for as long as is necessary by keeping rates low and ensuring lending markets remain highly liquid and easily accessible. The Fed’s dual mandate ensures that while inflation may be running high, the labor market remains the key determinant of when the Fed will consider withdrawing accommodative measures.
Economic data
The week is full with economic data releases that could lend itself to increased volatility. Major releases include: FOMC rate decision, US PCE inflation data, US GDP, and Canadian inflation figures.
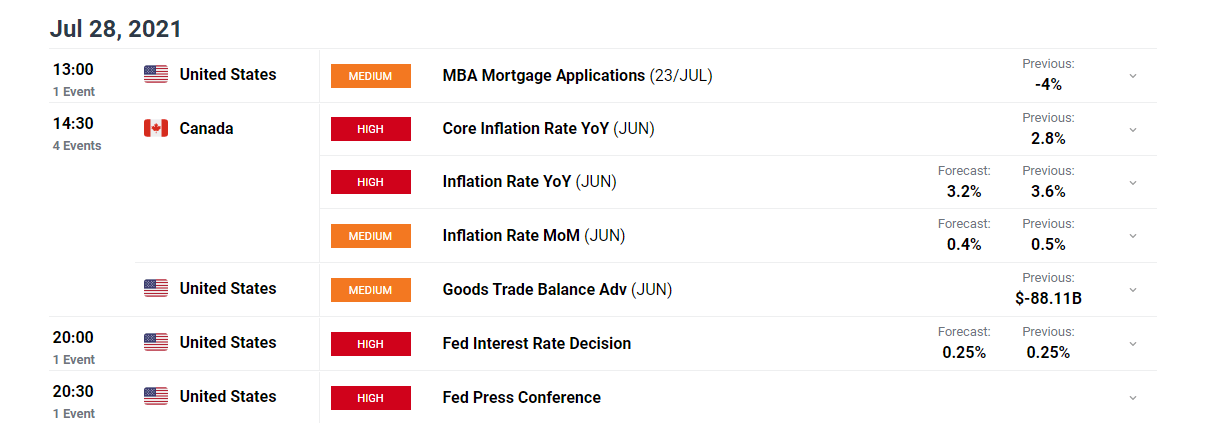
For all market-moving data releases and events see the DailyFX Economic Calendar
USD/CAD KEY TECHNICAL LEVELS
The weekly chart shows the continuation of the broader bullish move which retraced somewhat after breaking above the 23.6% Fib drawn from the March 2020 high to the 2021 low.
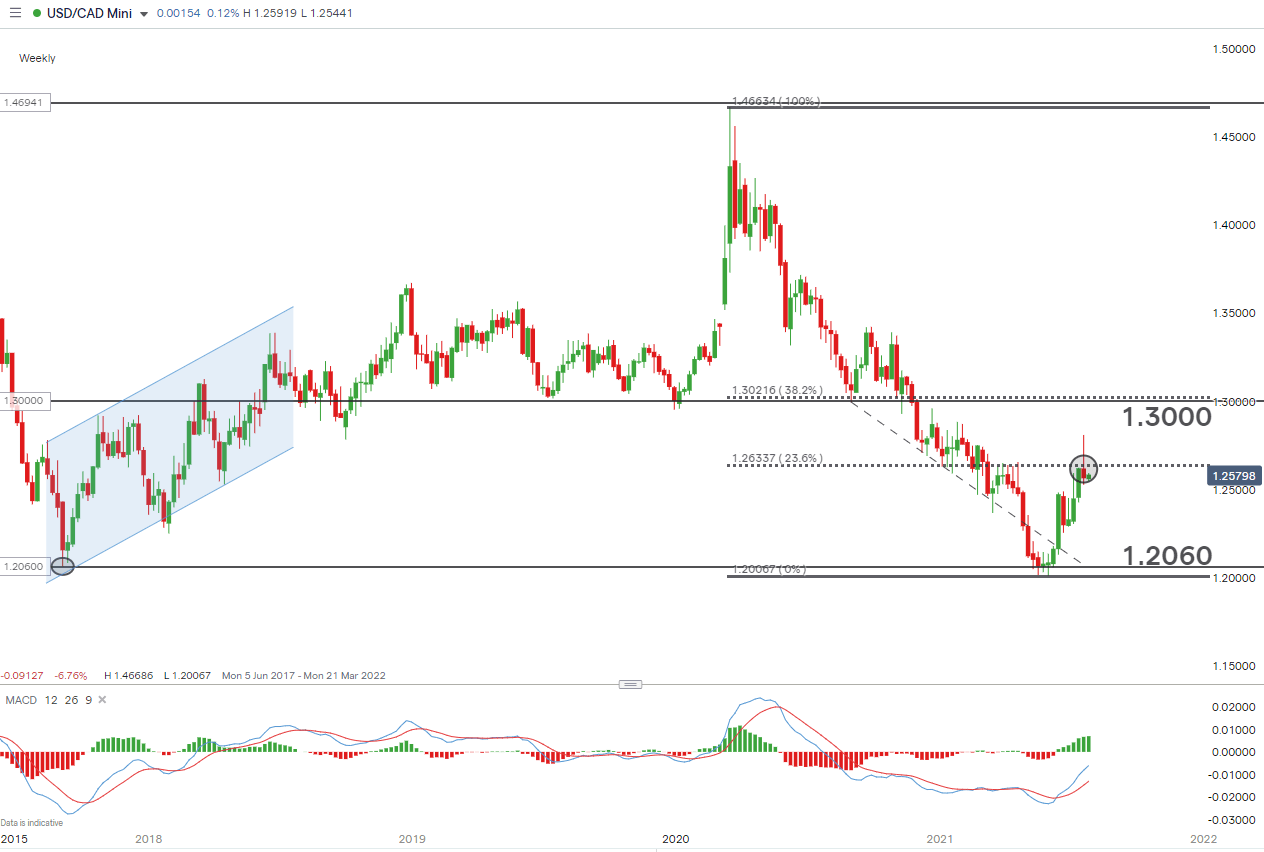
Chart prepared by Richard Snow, IG
The daily chart shows the ascending channel intact as price action consolidates near the lower bound of the channel. USD/CAD bulls may look to a bounce higher off this level should the dollar strengthen. Immediate resistance coincides with the 23.6% Fib level at around 1.2630 and thereafter, the 1.2775 – 1.2810 zone of support.
However, in light of anticipated volatility, the risk of a breakdown should not be discounted. A break beneath the channel would highlight the recent low of 1.2440 as the nearest level of support before the 1.2300 level comes into focus.
USD/CAD Daily Chart

Chart prepared by Richard Snow, IG
Disclaimer: See the full disclosure for DailyFX here.


