- USD/INR is defending the 200-SMA support on the 4H chart.
- The 50 and 100-SMAs confluence at 74.57 continue to guard the upside.
- RSI ticks higher but remains below the midline, backing the bears.
After witnessing good two-way business on Monday, USD/INR is posting small gains in Tuesday’s Asian trading amid a mixed market sentiment.
The spot is hovering in the lower bound of the recent trading range blow mid-74s due to the recent decline in the US dollar across its main peers.
Looking at USD/INR’s four-hour chart, the cross has managed to defend the 200-Simple Moving Average (SMA) at 74.29 (for now).
With the Relative Strength Index (RSI) seeing an uptick, the price has bounced off lows. However, the leading indicator continues to hold within the bearish region, suggesting that the bearish bias remains well in place for the currency pair.
A four-hourly closing below the 200-SMA is needed to expose the 74.00 mark.
USD/INR: Four-hour chart
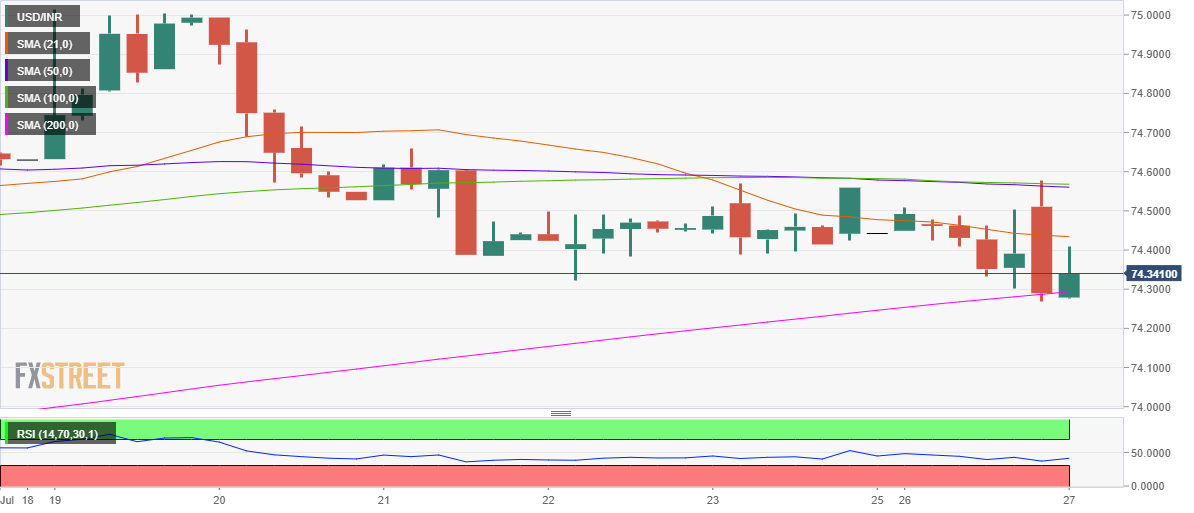
On the flip side, immediate resistance is placed at the mildly bearish 21-SMA at 74.43. Further up, the buyers could aim for the July 21 high of 74.66.
The bulls need a sustained break above 74.57, which is the confluence of the horizontal 50 and 100-SMAs, in order to sustain a meaningful recovery towards 0.7500.
USD/INR: Additional levels
Information on these pages contains forward-looking statements that involve risks and uncertainties. Markets and instruments profiled on this page are for informational purposes only and should not in any way come across as a recommendation to buy or sell in these assets. You should do your own thorough research before making any investment decisions. FXStreet does not in any way guarantee that this information is free from mistakes, errors, or material misstatements. It also does not guarantee that this information is of a timely nature. Investing in Open Markets involves a great deal of risk, including the loss of all or a portion of your investment, as well as emotional distress. All risks, losses and costs associated with investing, including total loss of principal, are your responsibility. The views and opinions expressed in this article are those of the authors and do not necessarily reflect the official policy or position of FXStreet nor its advertisers. The author will not be held responsible for information that is found at the end of links posted on this page.
If not otherwise explicitly mentioned in the body of the article, at the time of writing, the author has no position in any stock mentioned in this article and no business relationship with any company mentioned. The author has not received compensation for writing this article, other than from FXStreet.
FXStreet and the author do not provide personalized recommendations. The author makes no representations as to the accuracy, completeness, or suitability of this information. FXStreet and the author will not be liable for any errors, omissions or any losses, injuries or damages arising from this information and its display or use. Errors and omissions excepted.
The author and FXStreet are not registered investment advisors and nothing in this article is intended to be investment advice.
Recommended content
Editors’ Picks
EUR/USD clings to daily gains above 1.0650

EUR/USD gained traction and turned positive on the day above 1.0650. The improvement seen in risk mood following the earlier flight to safety weighs on the US Dollar ahead of the weekend and helps the pair push higher.
GBP/USD recovers toward 1.2450 after UK Retail Sales data

GBP/USD reversed its direction and advanced to the 1.2450 area after touching a fresh multi-month low below 1.2400 in the Asian session. The positive shift seen in risk mood on easing fears over a deepening Iran-Israel conflict supports the pair.
Gold holds steady at around $2,380 following earlier spike

Gold stabilized near $2,380 after spiking above $2,400 with the immediate reaction to reports of Israel striking Iran. Meanwhile, the pullback seen in the US Treasury bond yields helps XAU/USD hold its ground.
Bitcoin Weekly Forecast: BTC post-halving rally could be partially priced in Premium

Bitcoin price shows no signs of directional bias while it holds above $60,000. The fourth BTC halving is partially priced in, according to Deutsche Bank’s research.
Week ahead – US GDP and BoJ decision on top of next week’s agenda

US GDP, core PCE and PMIs the next tests for the Dollar. Investors await BoJ for guidance about next rate hike. EU and UK PMIs, as well as Australian CPIs also on tap.