- AUD/USD off lows around 0.7350, but not out of the woods yet.
- Bears are testing the bullish commitments at critical daily support.
- Escalating covid concerns remain a drop, with all eyes on the RBA decision.
AUD/USD has bounced back above 0.7350, tracking the rally in the S&P 500 futures amid a recovery in the risk appetite.
Expectations of more monetary stimulus support likely from China combined with the progress on the US infrastructure bill boost the market mood, weighing negatively on the safe-haven US dollar.
Despite the rebound in the aussie, its bearish potential appears intact amid surging covid cases in Australia and extension of the lockdowns across the country. Traders also remain on the back foot ahead of the US ISM Manufacturing PMI and Reserve Bank of Australia’s (RBA) monetary policy decision.
As observed on AUD/USD’s daily chart, the aussie is testing the critical rising trendline support at 0.7330.
A daily closing below the latter could validate a bear flag formation, with a sell-off towards 0.7200 likely on the cards. Ahead of that the spot could test the 0.7300 level.
The 14-day Relative Strength Index (RSI) remains below the midline, allowing room for more declines.
AUD/USD: Daily chart
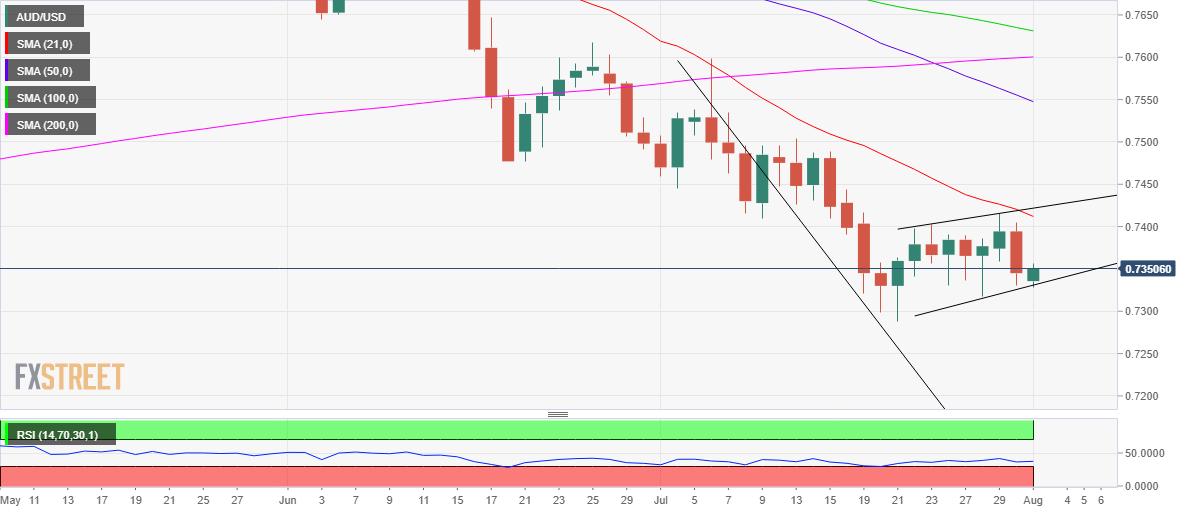
Meanwhile, any recovery attempts could face stiff resistance around 0.7420, where the bearish 21-Daily Moving Average (DMA) and rising trendline hurdle intersect.
A sustained break above the latter could negate the bearish momentum in the near term.
AUD/USD: Additional levels to consider
Information on these pages contains forward-looking statements that involve risks and uncertainties. Markets and instruments profiled on this page are for informational purposes only and should not in any way come across as a recommendation to buy or sell in these assets. You should do your own thorough research before making any investment decisions. FXStreet does not in any way guarantee that this information is free from mistakes, errors, or material misstatements. It also does not guarantee that this information is of a timely nature. Investing in Open Markets involves a great deal of risk, including the loss of all or a portion of your investment, as well as emotional distress. All risks, losses and costs associated with investing, including total loss of principal, are your responsibility. The views and opinions expressed in this article are those of the authors and do not necessarily reflect the official policy or position of FXStreet nor its advertisers. The author will not be held responsible for information that is found at the end of links posted on this page.
If not otherwise explicitly mentioned in the body of the article, at the time of writing, the author has no position in any stock mentioned in this article and no business relationship with any company mentioned. The author has not received compensation for writing this article, other than from FXStreet.
FXStreet and the author do not provide personalized recommendations. The author makes no representations as to the accuracy, completeness, or suitability of this information. FXStreet and the author will not be liable for any errors, omissions or any losses, injuries or damages arising from this information and its display or use. Errors and omissions excepted.
The author and FXStreet are not registered investment advisors and nothing in this article is intended to be investment advice.
Recommended content
Editors’ Picks
EUR/USD now shifts its attention to 1.0500

The ongoing upward momentum of the Greenback prompted EUR/USD to lose more ground, hitting new lows for 2024 around 1.0600, driven by the significant divergence in monetary policy between the Fed and the ECB.
GBP/USD stabilizes near 1.2450 ahead of Powell speech

GBP/USD holds steady at around 1.2450 after recovering from the multi-month low it touched near 1.2400 in the European morning. The USD struggles to gather strength after disappointing housing data. Market focus shifts to Fed Chairman Powell's appearance.
Gold aiming to re-conquer the $2,400 level

Gold stages a correction on Tuesday and fluctuates in negative territory near $2,370 following Monday's upsurge. The benchmark 10-year US Treasury bond yield continues to push higher above 4.6% and makes it difficult for XAU/USD to gain traction.
Bitcoin price defends $60K as whales hold onto their BTC despite market dip

Bitcoin (BTC) price still has traders and investors at the edge of their seats as it slides further away from its all-time high (ATH) of $73,777. Some call it a shakeout meant to dispel the weak hands, while others see it as a buying opportunity.
US outperformance continues

The economic divergence between the US and the rest of the world has become increasingly pronounced. The latest US inflation prints highlight that underlying inflation pressures seemingly remain stickier than in most other parts of the world.