- USD/INR falls for the third day in a row after facing rejection at 21-DMA.
- The spot looks to challenge the 50-DMA support at 74.00.
- RSI edges lower below the midline, supporting USD/INR bears.
USD/INR is off the six-week lows of 74.08 but remains heavy for the third straight day on Wednesday.
The Indian rupee gains strength on the back of the domestic indices at record highs and IPO inflows. However, the spot trimmed losses amid a fresh jump seen in the US dollar across the board.
The pair now awaits the US ADP and ISM Services PMI data for fresh trading opportunities.
Technically, USD/INR almost tested the upward-sloping 50-Daily Moving Average (DMA) support at 74.00 on Wednesday, having faced rejection at the mildly bearish 21-DMA cap at 74.50 earlier this week.
The latest leg lower has prompted a breach of the rising trendline support at 74.22. A daily closing below that level is needed to renew the downside momentum.
If the bears manage to take out the 50-DMA barrier, then the spot could test the bullish 100-DMA at 73.85.
Adding credence to the down move, the Relative Strength Index (RSI) looks south below the central line, currently at 45.10.
A four-hourly closing below the 200-SMA is needed to expose the 74.00 mark.
USD/INR: Daily chart
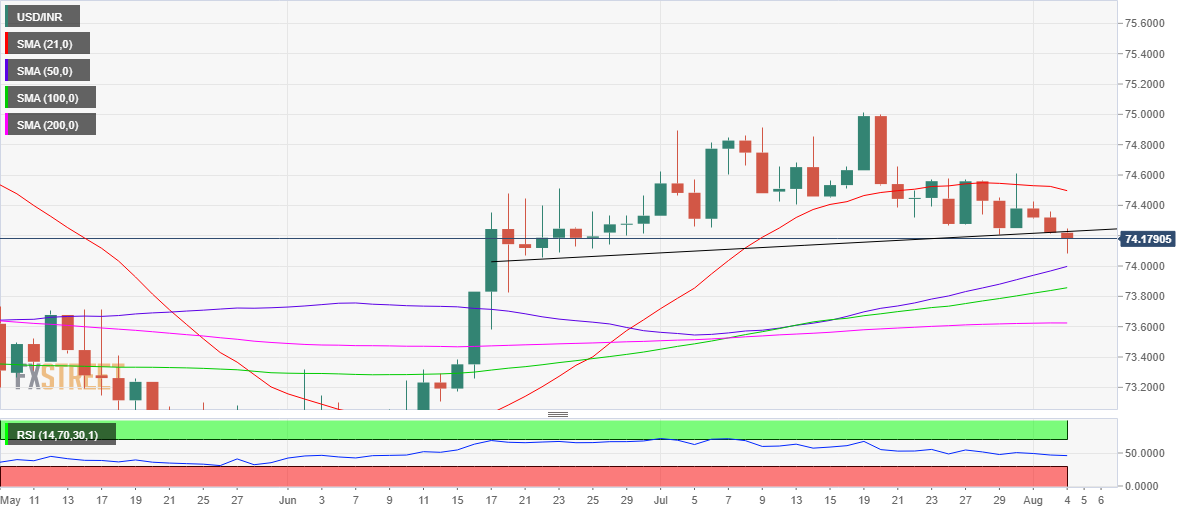
On the flip side, the bulls need to crack a strong resistance zone around 74.40 to take on the 21-DMA upside hurdle.
Recapturing the 21-DMA is critical to negating the bearish bias in the near term.
USD/INR: Additional levels
Information on these pages contains forward-looking statements that involve risks and uncertainties. Markets and instruments profiled on this page are for informational purposes only and should not in any way come across as a recommendation to buy or sell in these assets. You should do your own thorough research before making any investment decisions. FXStreet does not in any way guarantee that this information is free from mistakes, errors, or material misstatements. It also does not guarantee that this information is of a timely nature. Investing in Open Markets involves a great deal of risk, including the loss of all or a portion of your investment, as well as emotional distress. All risks, losses and costs associated with investing, including total loss of principal, are your responsibility. The views and opinions expressed in this article are those of the authors and do not necessarily reflect the official policy or position of FXStreet nor its advertisers. The author will not be held responsible for information that is found at the end of links posted on this page.
If not otherwise explicitly mentioned in the body of the article, at the time of writing, the author has no position in any stock mentioned in this article and no business relationship with any company mentioned. The author has not received compensation for writing this article, other than from FXStreet.
FXStreet and the author do not provide personalized recommendations. The author makes no representations as to the accuracy, completeness, or suitability of this information. FXStreet and the author will not be liable for any errors, omissions or any losses, injuries or damages arising from this information and its display or use. Errors and omissions excepted.
The author and FXStreet are not registered investment advisors and nothing in this article is intended to be investment advice.
Recommended content
Editors’ Picks
EUR/USD edges lower toward 1.0700 post-US PCE

EUR/USD stays under modest bearish pressure but manages to hold above 1.0700 in the American session on Friday. The US Dollar (USD) gathers strength against its rivals after the stronger-than-forecast PCE inflation data, not allowing the pair to gain traction.
GBP/USD retreats to 1.2500 on renewed USD strength

GBP/USD lost its traction and turned negative on the day near 1.2500. Following the stronger-than-expected PCE inflation readings from the US, the USD stays resilient and makes it difficult for the pair to gather recovery momentum.
Gold keeps its daily gains near $2,350 following US inflation

Gold prices maintain their constructive bias around $2,350 after US inflation data gauged by the PCE surpassed consensus in March and US yields trade with slight losses following recent peaks.
Bitcoin Weekly Forecast: BTC’s next breakout could propel it to $80,000 Premium

Bitcoin’s recent price consolidation could be nearing its end as technical indicators and on-chain metrics suggest a potential upward breakout. However, this move would not be straightforward and could punish impatient investors.
Week ahead – Hawkish risk as Fed and NFP on tap, Eurozone data eyed too

Fed meets on Wednesday as US inflation stays elevated. Will Friday’s jobs report bring relief or more angst for the markets? Eurozone flash GDP and CPI numbers in focus for the Euro.