
US Dollar Pre-NFP Price Action Setups: EUR/USD, GBP/USD And USD/CAD
The US Dollar is currently holding on to a net gain for the week, in large part due to an unexpected comment yesterday from FOMC Vice Chair, Richard Clarida. Even though Powell had assuaged market fears around taper and rate hikes a week earlier, Clarida warned that the bank may have conditions met for tapering asset purchases sooner rather than later. And in short order, the US Dollar surged from a key zone of support to set a fresh two-week-high.
This bullish move seemingly printed in the face of contradictory data: In Powell’s remarks at the July FOMC rate decision, he continued to point to weakness in the labor market as the primary reason for the Fed staying loose and passive. He noted how jobs remain the component that needs to see ‘significant further progress’ before the bank looks at making a move, and yesterday morning produced a very bad ADP release with the print missing the expectation by more than 50%. That helped to push USD down to support before those Clarida comments came in.
Tomorrow shifts the focus back on to employment. July Non-farm Payrolls will be released and the expectation is for a print of +870k with an unemployment rate of 5.7%. Keep in mind, it was a disappointing print in the unemployment rate last month that seemed to offset a strong headline number, so robust jobs growth is going to be the focus for a continuation of USD strength.
US DOLLAR FOUR-HOUR PRICE CHART
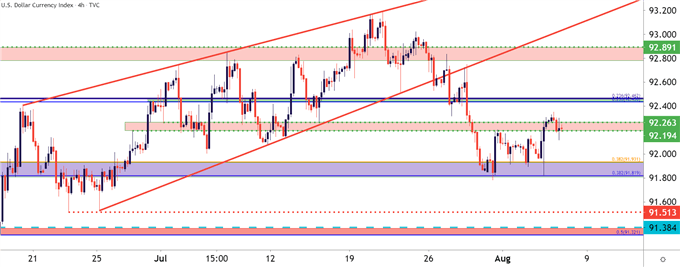
Chart prepared by James Stanley; USD, DXY on Tradingview
EUR/USD HOLDING RESISTANCE AT PRIOR SUPPORT
That spurt of USD-strength yesterday up-ended a brewing breakout in EUR/USD. The pair was pushing up to the 1.1900 handle but as Clarida’s comments filtered in, EUR/USD pushed down to a fresh weekly low before stabilizing. At this point, prices have been garnering resistance from a batch of prior support; and this plots around a Fibonacci level of note, as the 23.6% retracement of the 2021 major move.
On a bigger-picture basis, the 2021 low rests around a couple of Fibonacci levels plotted at 1.1709 and 1.1736, and this could function as a longer-term area of support to follow for bearish scenarios in the pair.
EUR/USD FOUR-HOUR PRICE CHART
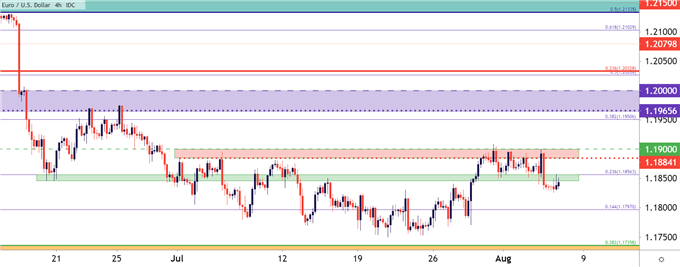
Chart prepared by James Stanley; EURUSD on Tradingview
GBP/USD HOLDS FIBONACCI SUPPORT
For bearish USD-scenarios, GBP/USD remains attractive. I’ve been following this one for the past week as prices were gearing up for a breakout at a big level ahead of last week’s FOMC rate decision. As USD sold-off, GBP/USD broke-out, but fell short of testing the 1.4000 psychological level. This week’s USD-strength brought in yet another support test, the context of which was explored in yesterday’s webinar.
The pair can remain attractive for USD-weakness scenarios, looking for prices to move back towards the 1.4000 psychological level.
GBP/USD FOUR-HOUR PRICE CHART
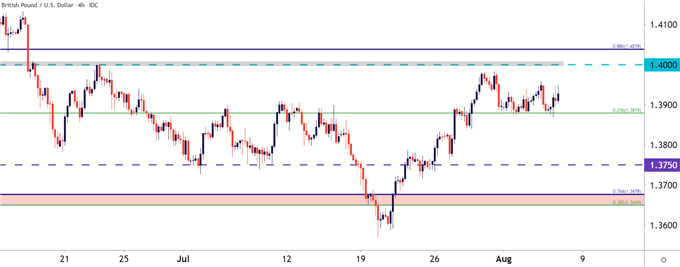
Chart prepared by James Stanley; GBPUSD on Tradingview
USD/CAD: AT A BIG SPOT BEFORE DUAL JOBS RELEASES
Also at 8:30 AM ET, tomorrow will be the release of Canadian jobs numbers, making for a busy morning in USD/CAD as both represented economies will be releasing high-impact data at the same time.
USD/CAD has been of interest recently as reversal themes started to show through June and July. Mid-July in particular saw a strong trend develop as prices broke above the 1.2500-1.2622 zone on the charts, as USD/CAD was on the way to setting a fresh high at the 1.2800 psychological level.
Since then, however, a different tone has shown and prices have scaled back, and last week tested the 1.2423 level which is confluent with a bullish trendline. That strength could not hold, however, and even with yesterday’s flare of USD-strength, USD/CAD is net-down over the past two days.
There’s one more spot of support and that’s from the trendline projection; but this could be potentially setting up for another wave of bearish price action given the lack of strength shown by bulls in holding price above a key zone of support, even as the US Dollar was relatively strong.
USD/CAD DAILY PRICE CHART
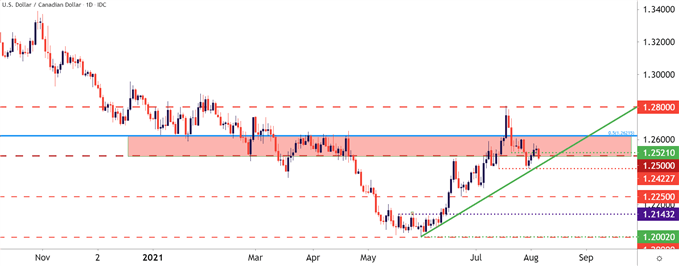
Chart prepared by James Stanley; USDCAD on Tradingview
Disclaimer: DailyForex will not be held liable for any loss or damage resulting from reliance on the information contained within this website including market news, analysis, trading signals ...
more

