- US dollar is under pressure and makes way for trading opportunities in forex.
- The commodity complex has been given a boost in positive sentiment.
- CAD crosses are in focus, GBP/CAD is ripening for a shorting opportunity below 1.7350.
An interesting fundamental development in forex markets occurred on Friday that tips the balance of favouritism to the commodity complex, supporting the outlook for AUD, NZD and CAD specifically.
The greenback is on the back foot:
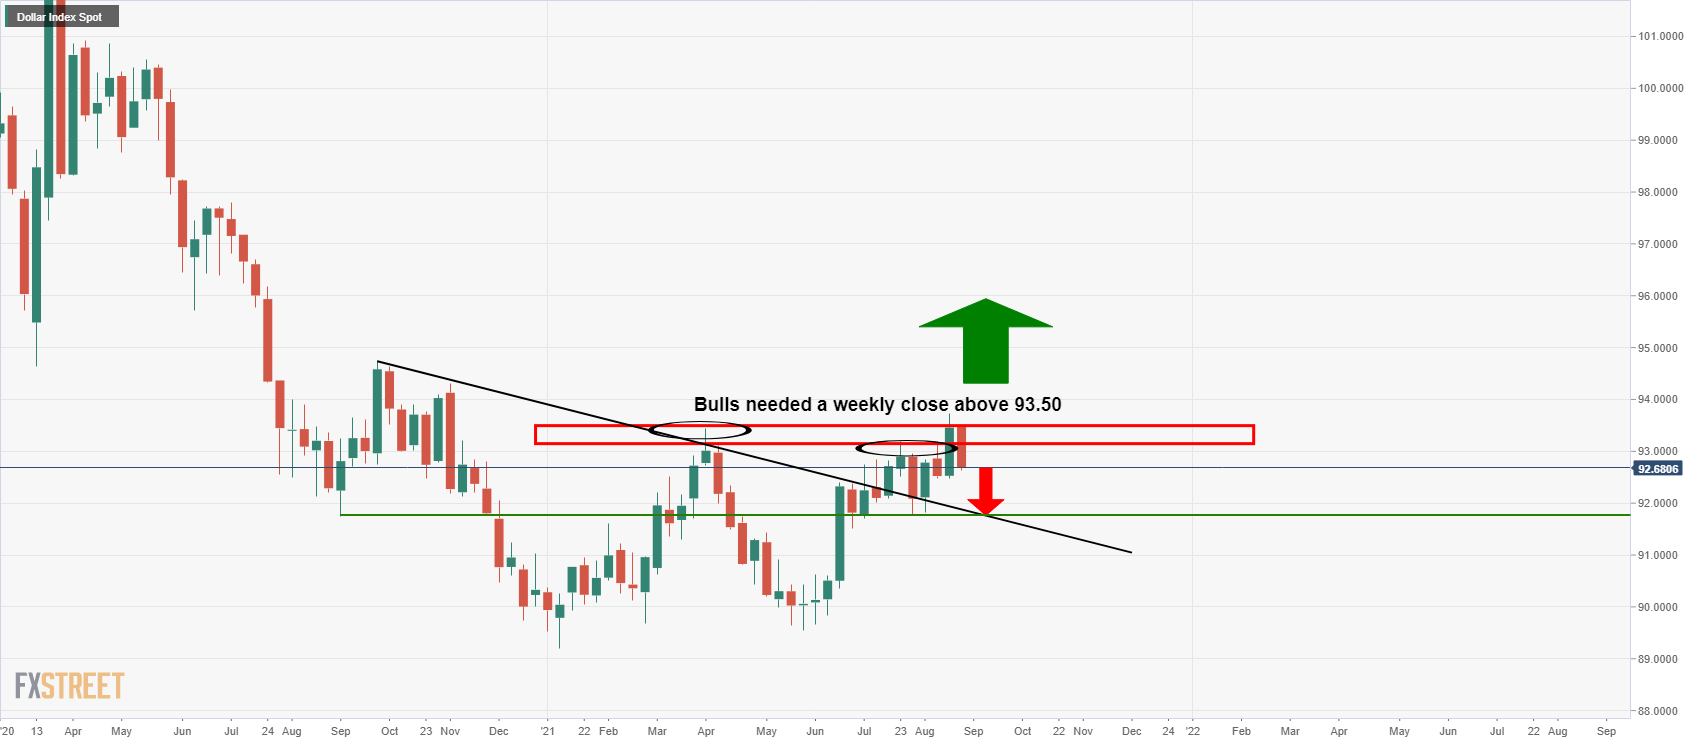
DXY daily and weekly charts
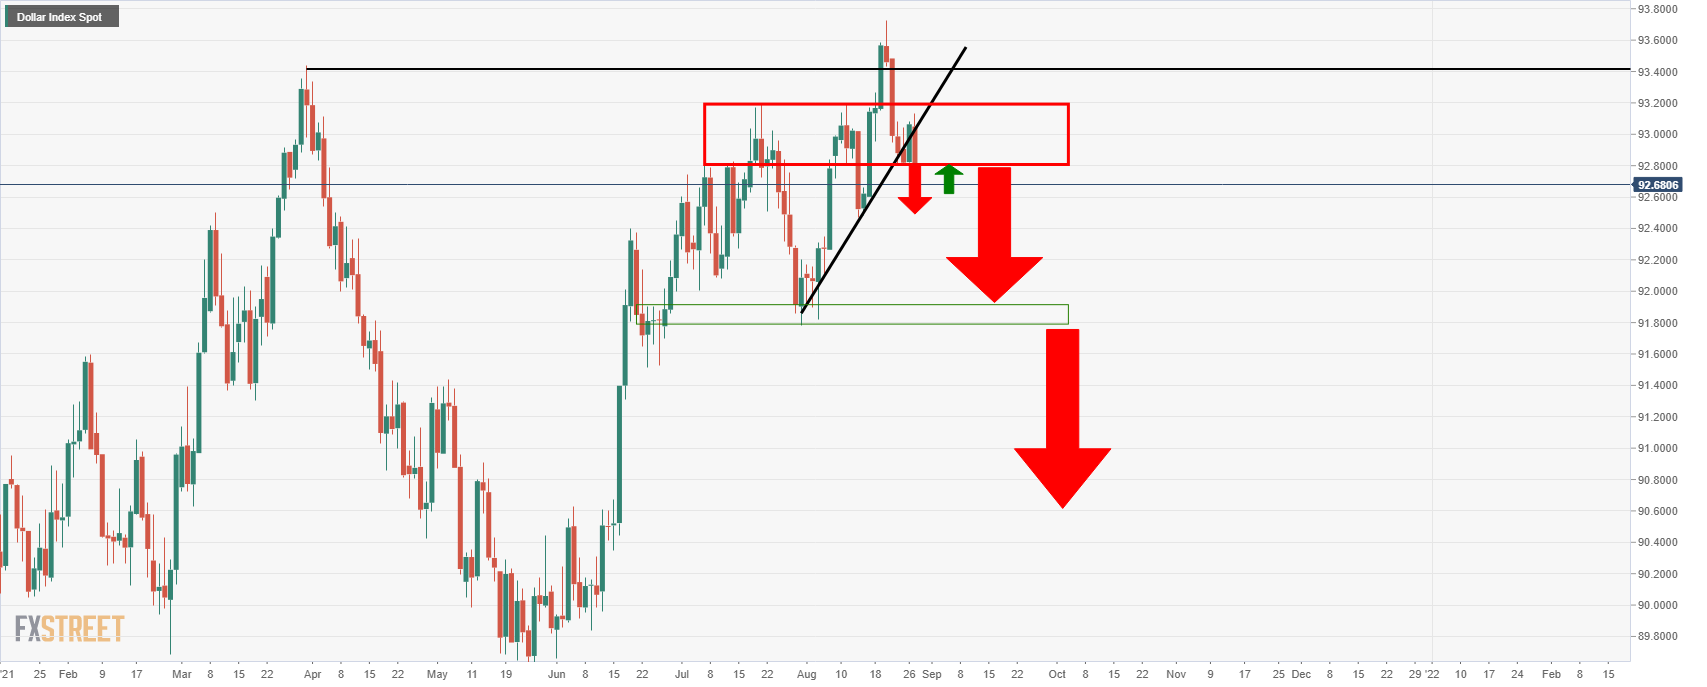
From a daily perspective, the DXY is testing the grounds for a breakout below the dynamic support, and it failed to close above 93.50 on a weekly basis.
This leaves the focus on 91.80 support:
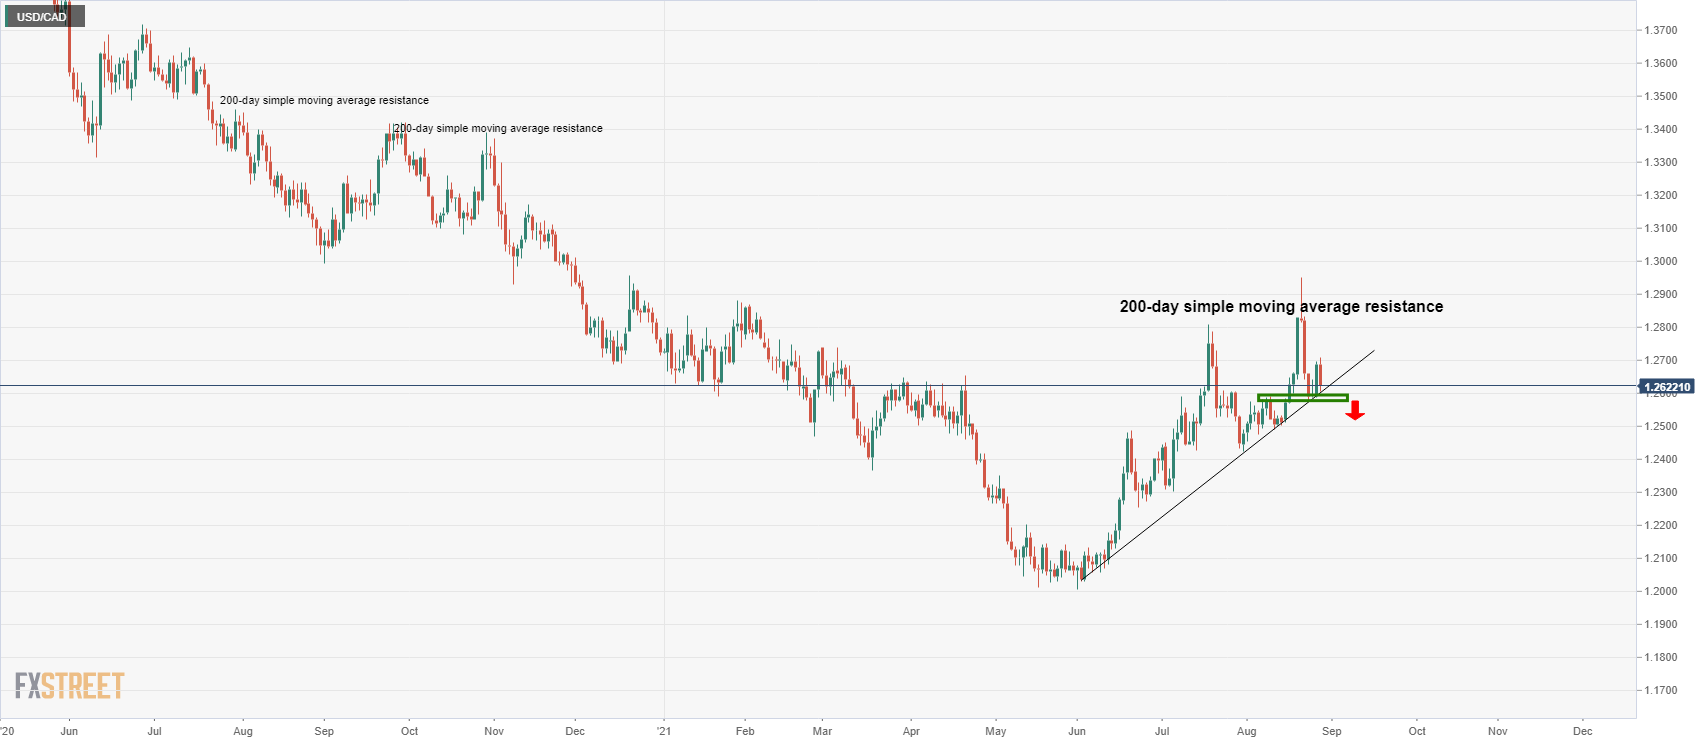
USD/CAD analysis
Meanwhile, in a soft US dollar environment, combined with the prior failures to sustain a bullish move beyond the 200-day Simple Moving Average (SMA), USD/CAD is on the verge of a bearish breakout below dynamic support as follows:
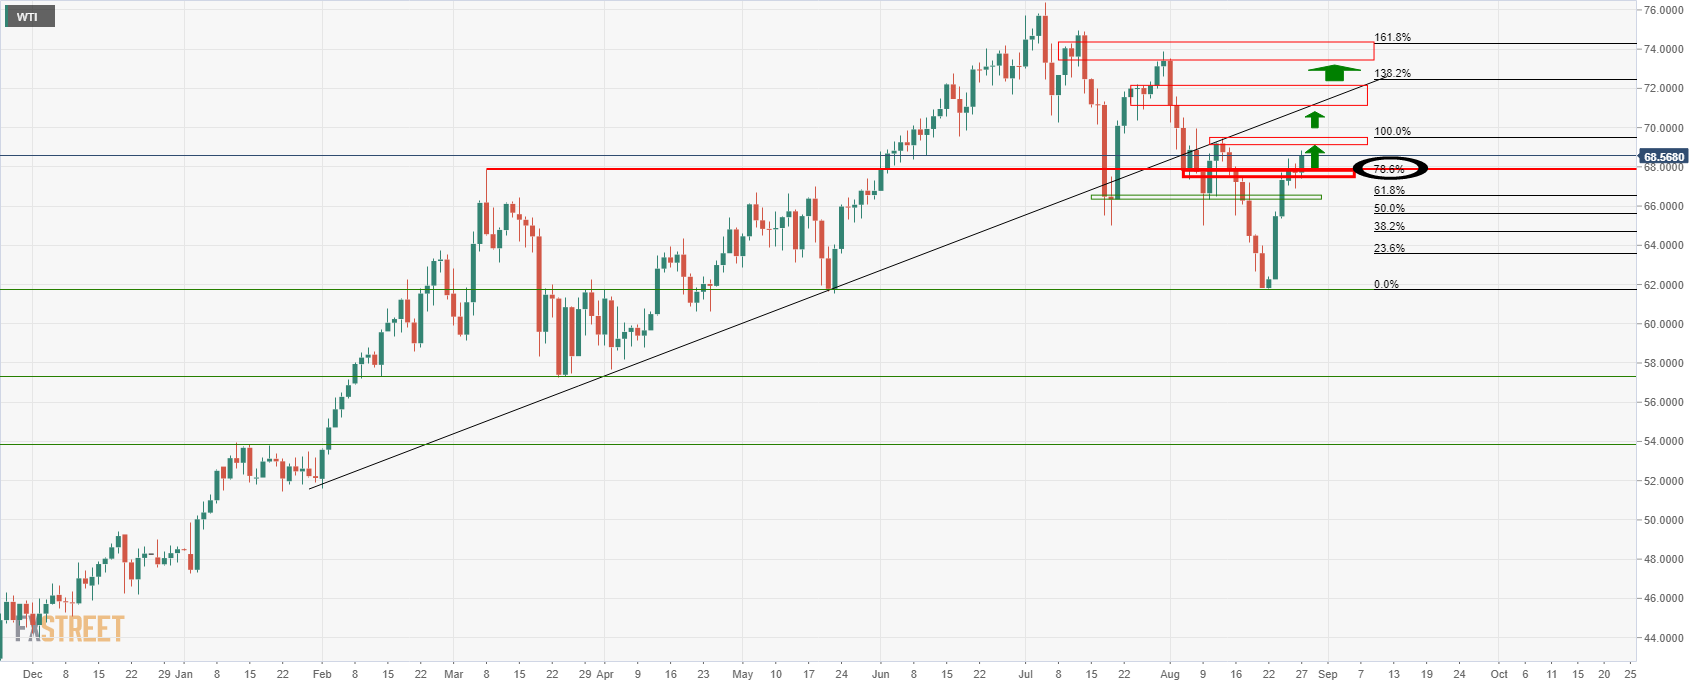
While above the 78.6% Fibonacci, the prospects of a rise in WTI toward $69.50 due to the start of the week's Gulf Hurricane Ida fundamentals should also play into the hands of the Canadian dollar:
GBP/CAD analysis
Looking at the crosses, the most compelling prospect comes with a multi time frame analysis on GBP/CAD in a potential high probability set-up from a swing trading perspective.
Starting on the monthly outlook, we are in the final days of August, and there are prospects of a bearish close as follows:
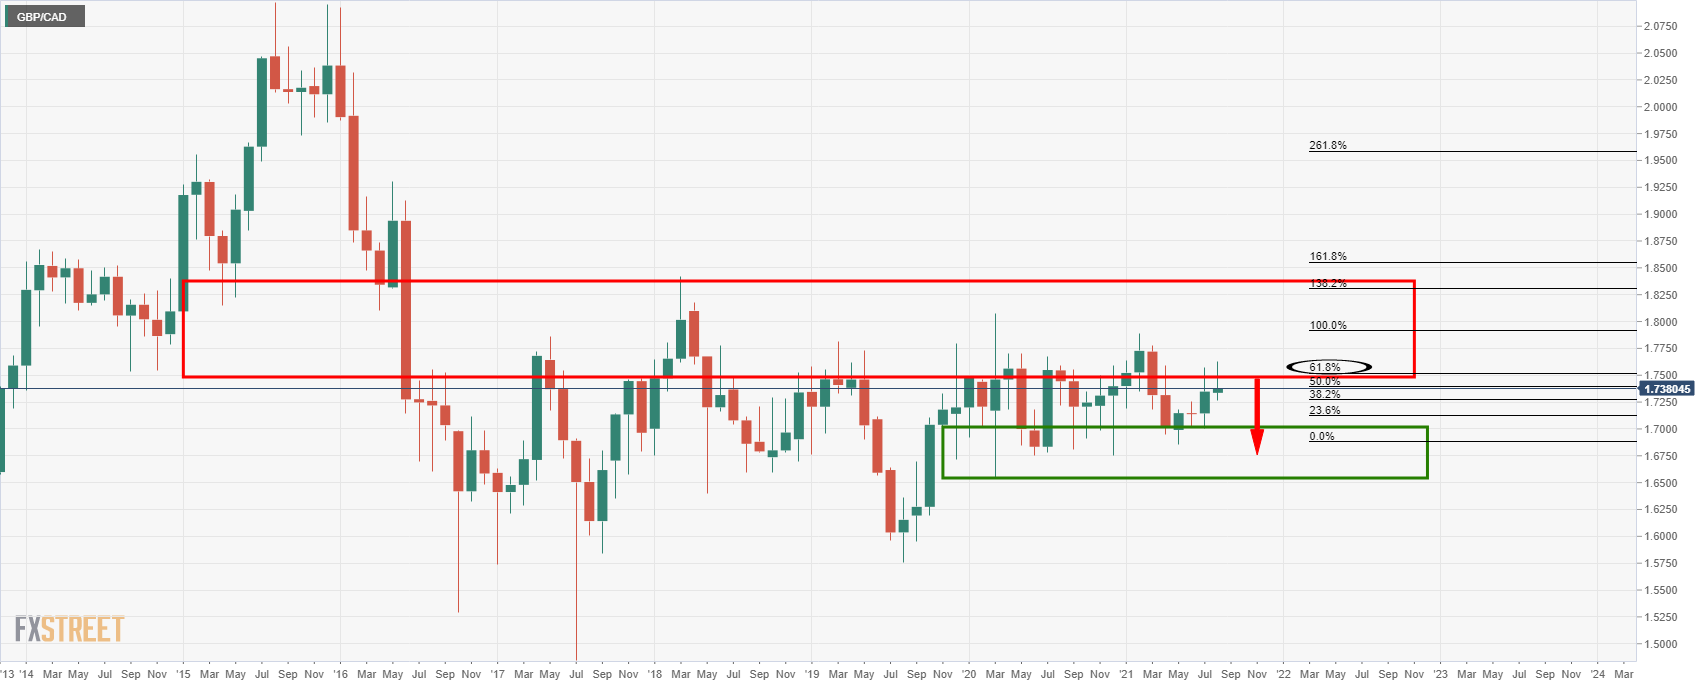
A bearish shooting star candle will be left if the price closes below 1.7346.
The fact that the candle has already tested supply territory and failed near the 61.8% Fibo is bearish in itself.
The W-formation is also bearish, and the wick has a confluence with the 61.8% Fibo of the last bullish impulse for a target:
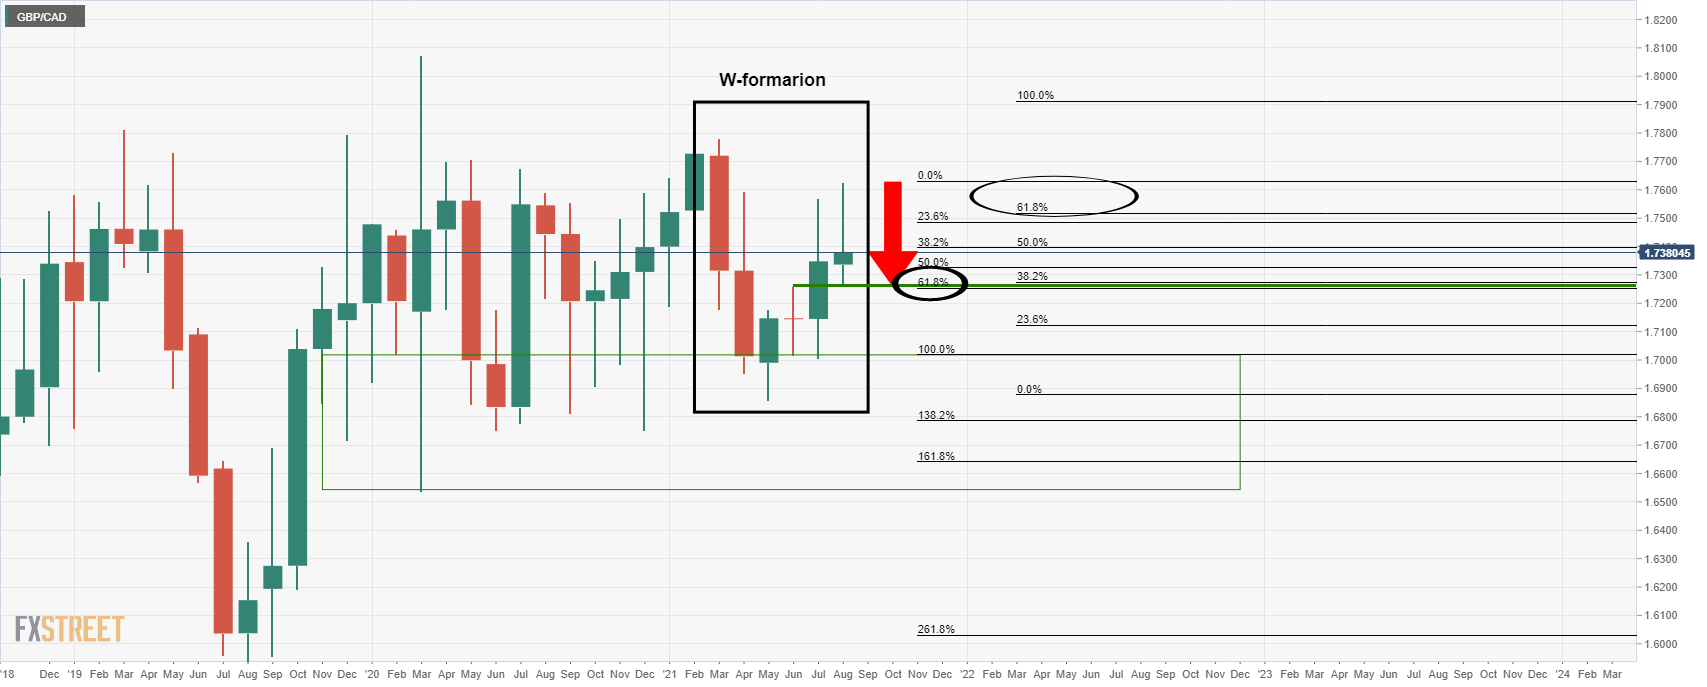
Weekly chart
Moving down to the weekly chart, the price closed bearish, and the wick's lows can be targeted for the week ahead:
The weekly wick represents the daily bullish correction that would be expected to lead to a downside daily bearish continuation toward and/or beyond the 61.8% weekly Fibo and monthly W-formation neckline, as follows:
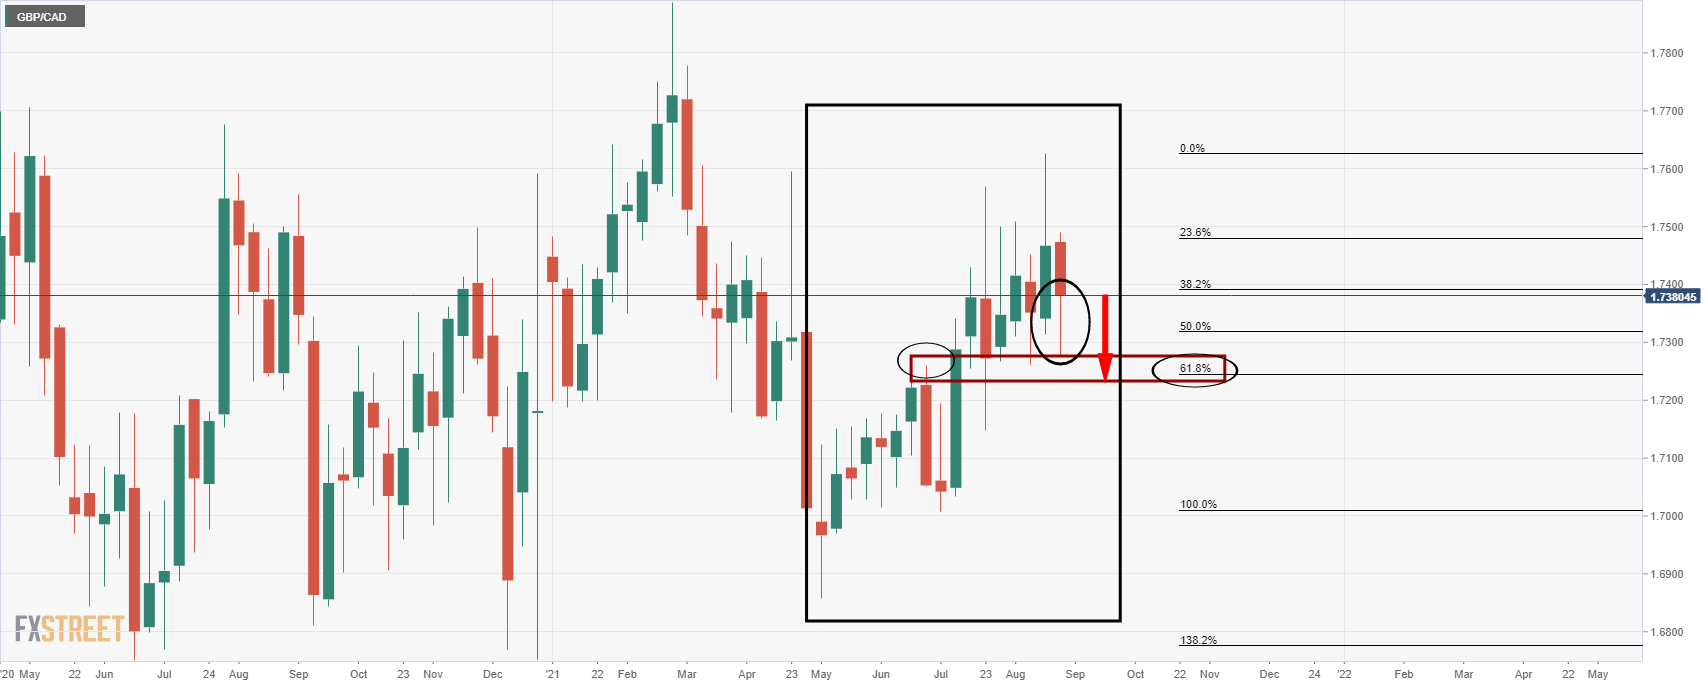
Daily chart
This leaves prospects of a daily doji in failures to hold above the 38.2% Fibo.
A break of the monthly neckline in the 1.7260s opens risk to 1.7180 as a -61.8% of the daily correction's range ahead of the July 21 lows of 1.7150.
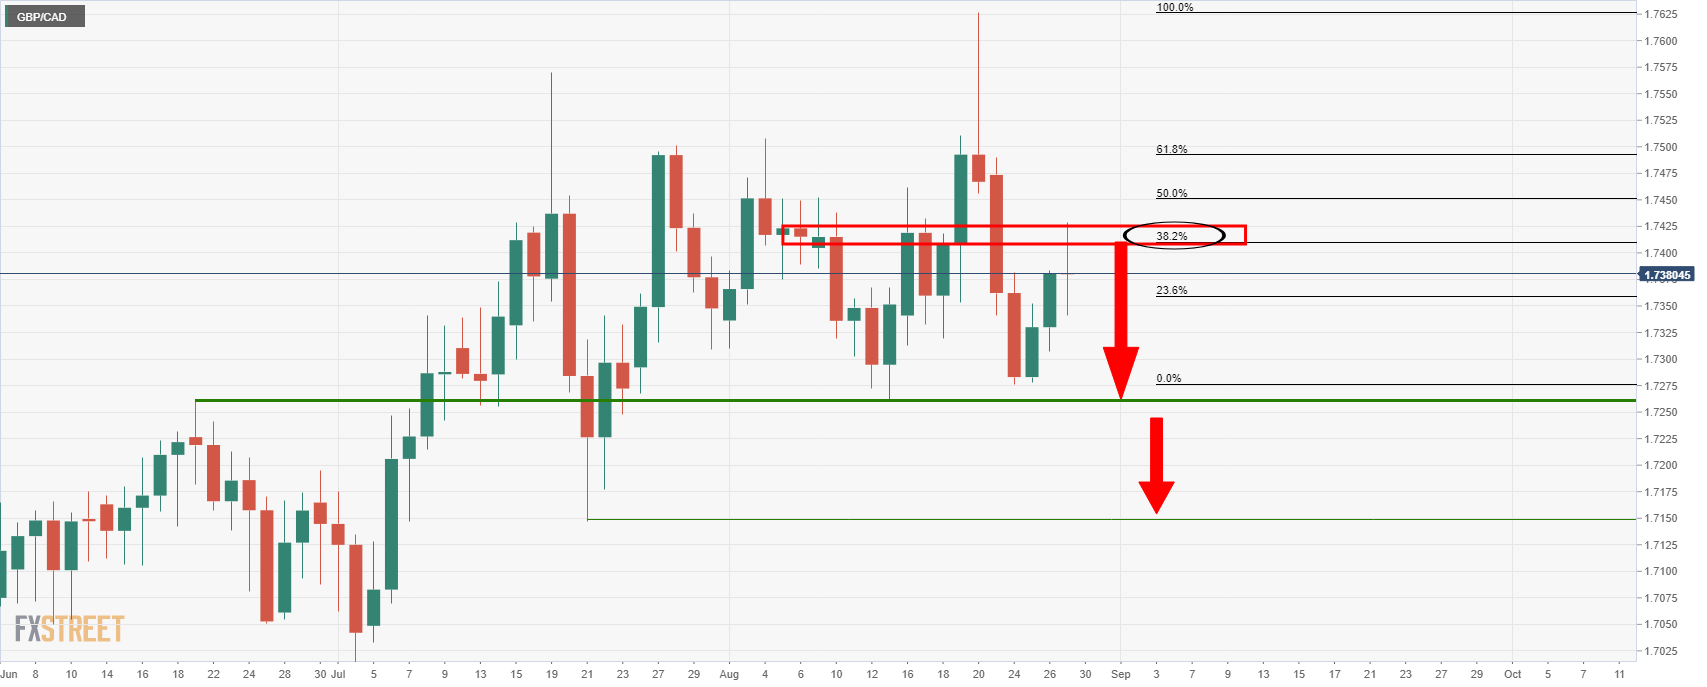
4-hour chart
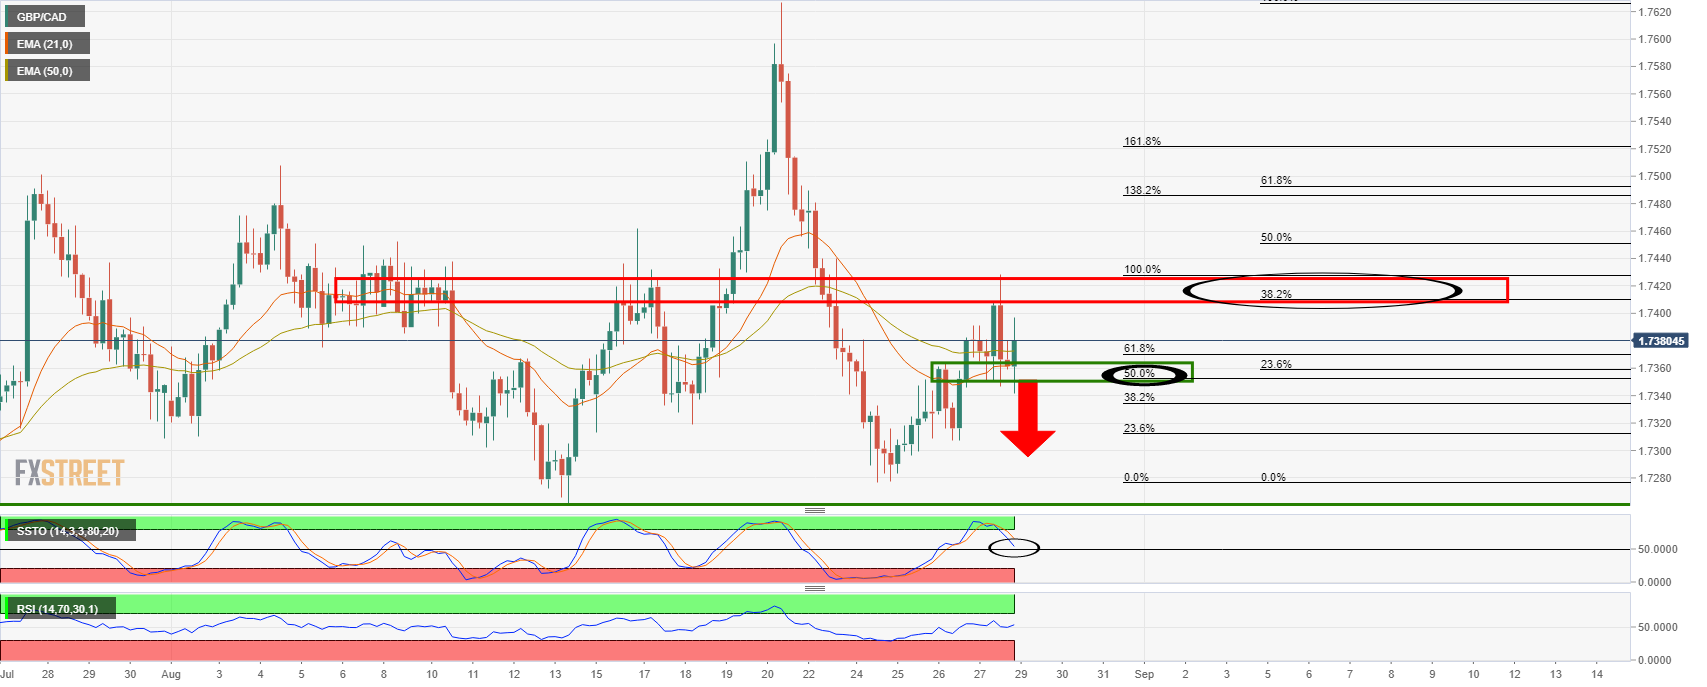
The 21 EMA remains below the 50 EMA, and that is bearish.
The Slow Stochastic Oscillator is also bearish and on the verge of penetrating 50 as is the Relative Strength Index (RSI).
Sell orders near the 50% mean reversion will likely be the tipping point for the cross, making for a level below 1.7350 an optimal entry point.
Information on these pages contains forward-looking statements that involve risks and uncertainties. Markets and instruments profiled on this page are for informational purposes only and should not in any way come across as a recommendation to buy or sell in these assets. You should do your own thorough research before making any investment decisions. FXStreet does not in any way guarantee that this information is free from mistakes, errors, or material misstatements. It also does not guarantee that this information is of a timely nature. Investing in Open Markets involves a great deal of risk, including the loss of all or a portion of your investment, as well as emotional distress. All risks, losses and costs associated with investing, including total loss of principal, are your responsibility. The views and opinions expressed in this article are those of the authors and do not necessarily reflect the official policy or position of FXStreet nor its advertisers. The author will not be held responsible for information that is found at the end of links posted on this page.
If not otherwise explicitly mentioned in the body of the article, at the time of writing, the author has no position in any stock mentioned in this article and no business relationship with any company mentioned. The author has not received compensation for writing this article, other than from FXStreet.
FXStreet and the author do not provide personalized recommendations. The author makes no representations as to the accuracy, completeness, or suitability of this information. FXStreet and the author will not be liable for any errors, omissions or any losses, injuries or damages arising from this information and its display or use. Errors and omissions excepted.
The author and FXStreet are not registered investment advisors and nothing in this article is intended to be investment advice.
Recommended Content
Editors’ Picks
AUD/USD failed just ahead of the 200-day SMA

Finally, AUD/USD managed to break above the 0.6500 barrier on Wednesday, extending the weekly recovery, although its advance faltered just ahead of the 0.6530 region, where the key 200-day SMA sits.
EUR/USD met some decent resistance above 1.0700

EUR/USD remained unable to gather extra upside traction and surpass the 1.0700 hurdle in a convincing fashion on Wednesday, instead giving away part of the weekly gains against the backdrop of a decent bounce in the Dollar.
Gold stays firm amid higher US yields as traders await US GDP data

Gold recovers from recent losses, buoyed by market interest despite a stronger US Dollar and higher US Treasury yields. De-escalation of Middle East tensions contributed to increased market stability, denting the appetite for Gold buying.
Ethereum suffers slight pullback, Hong Kong spot ETH ETFs to begin trading on April 30

Ethereum suffered a brief decline on Wednesday afternoon despite increased accumulation from whales. This follows Ethereum restaking protocol Renzo restaked ETH crashing from its 1:1 peg with ETH and increased activities surrounding spot Ethereum ETFs.
Dow Jones Industrial Average hesitates on Wednesday as markets wait for key US data

The DJIA stumbled on Wednesday, falling from recent highs near 38,550.00 as investors ease off of Tuesday’s risk appetite. The index recovered as US data continues to vex financial markets that remain overwhelmingly focused on rate cuts from the US Fed.