Join Our Telegram channel to stay up to date on breaking news coverage
Litecoin Price Prediction – September 3
The Litecoin price may continue to show an upward trend if the market could rise above the $200 resistance level.
LTC/USD Market
Key Levels:
Resistance levels: $210, $220, $230
Support levels: $160, $150, $140
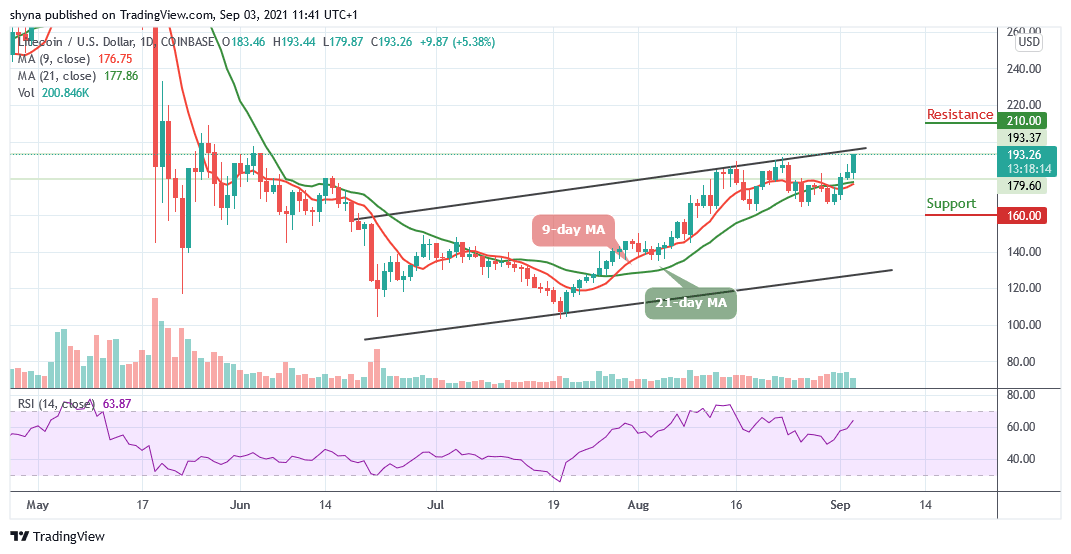
LTC/USD is currently showing positive movement for the past four days as the market continues to move above the 9-day and 21-day moving averages. Apart from this, the price of Litecoin still maintains an upward movement within the channel and traders can expect the price to continue to rise as soon as the bulls put more pressure on the market.
Litecoin Price Prediction: Litecoin Price Ready for More Upsides
The daily chart shows that the Litecoin price stays above the 9-day and 21-day moving averages and traders may expect a bullish continuation above the upper boundary of the channel which could test the resistance level of $195. Similarly, the technical indicator reveals Relative Strength Index (14) remains below 70-level but crossing into the overbought region may locate the potential resistance levels at $210, $220, and $230 in the long term.
Furthermore, if the Litecoin price continues to maintain the rising channel pattern, traders may witness a more bullish trend in the coming trading sessions. Meanwhile, a bearish breakdown may likely play out for this market if the Litecoin price withdraws back below the 9-day and 21-day moving averages and this could roll the coin back to the long-term support at $160, $150, and $140 levels.
Against Bitcoin, the Litecoin price is seen following the bullish movement as the coin trades above the 9-day and 21-day moving averages within the descending channel. More so, if the bulls continue to gain momentum, they are likely to keep releasing more bullish pressure on the market as the technical indicator RSI (14) stays above 60-level, suggesting more bullish signals.
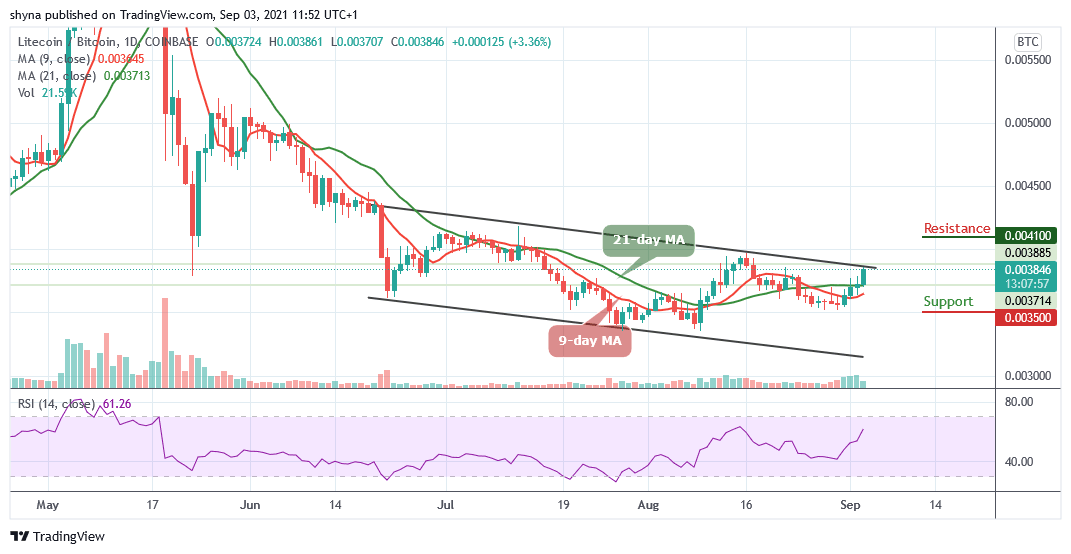
Moreover, if LTC/BTC falls below the 9-day and 21-day moving averages, this drop may bring it to the nearest support at 3600 SAT and any further bearish movement could lower the price to the support level of 3500 SAT and below. On the contrary, if the coin follows a bullish movement and crosses above the upper boundary of the channel, traders could see a bull-run to the resistance level of 4100 SAT and above.
Looking to buy or trade Litecoin (LTC) now? Invest at eToro!
75% of retail investor accounts lose money when trading CFDs with this provider
Join Our Telegram channel to stay up to date on breaking news coverage