
Advertisement
Advertisement
EOS, Stellar’s Lumen, and Tron’s TRX – Daily Analysis – September 21st, 2021
By:
Following Monday's sell-off, a move through the day's pivot levels would be needed to avoid another day in the red.

In this article:
EOS
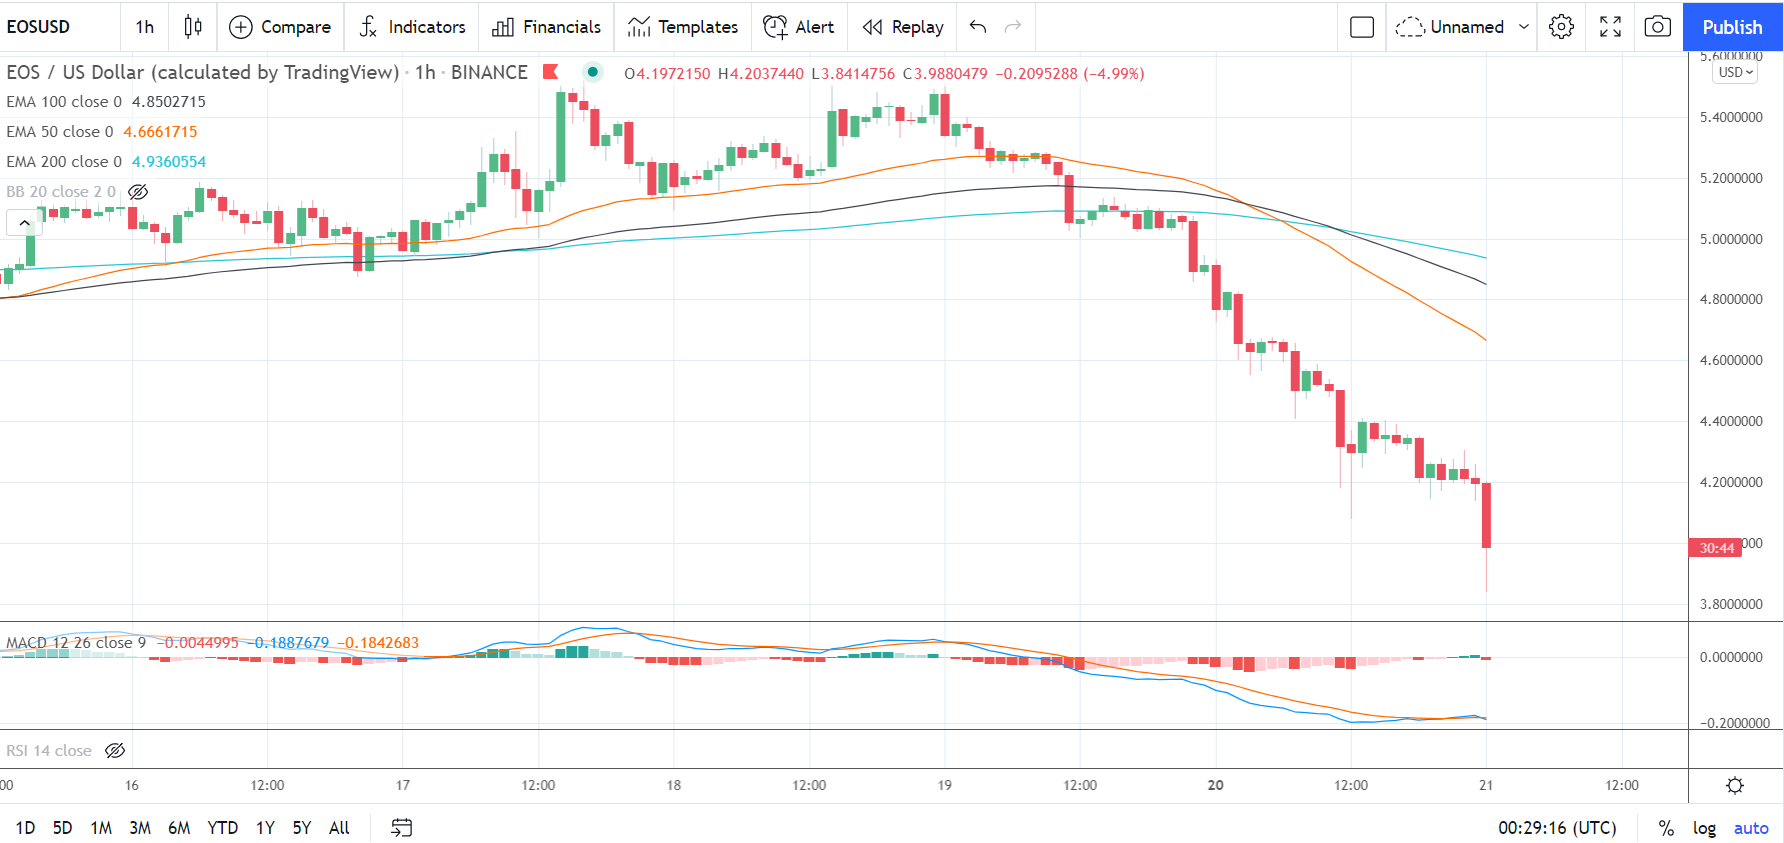
EOS tumbled by 14.58% on Monday. Following a 10.23% slump on Sunday, EOS ended the day at $4.1976.
A mixed start to the day saw EOS rise to an early morning intraday high $4.9318 before hitting reverse.
Falling short of the first major resistance level at $5.326, EOS slid to a mid-day intraday low $4.0828.
The reversal saw EOS fall through the first major support level at $4.6805 and the second major support level at $4.4471 to end the day at sub-$4.20 levels.
At the time of writing, EOS was down by 4.99% to $3.9881. A mixed start to the day saw EOS rise to an early morning high $4.2037 before falling to a low $3.8415.
EOS tested the first major support level at $3.8763 early on.
For the day ahead
EOS would need to move through the $4.4041 pivot to bring the first major resistance level at $4.7253 into play.
Support from the broader market would be needed to break out from $4.50 levels.
Barring a broad-based crypto rally, the first major resistance and Monday’s high $4.9318 would likely cap any upside.
In the event of an extended rally, EOS could test the second major resistance level at $5.2531 before any pullback.
Failure to move through the $4.4041 pivot would bring the first major support level at $3.8763 back into play.
Barring an extended sell-off, however, EOS should steer clear of sub-$3.50 levels. The second major support level at $3.5551 should limit the downside.
Looking at the Technical Indicators
First Major Support Level: $3.8763
First Major resistance Level: $4.7253
23.6% FIB Retracement Level: $6.52
38% FIB Retracement Level: $9.68
62% FIB Retracement Level: $14.77
Stellar’s Lumen
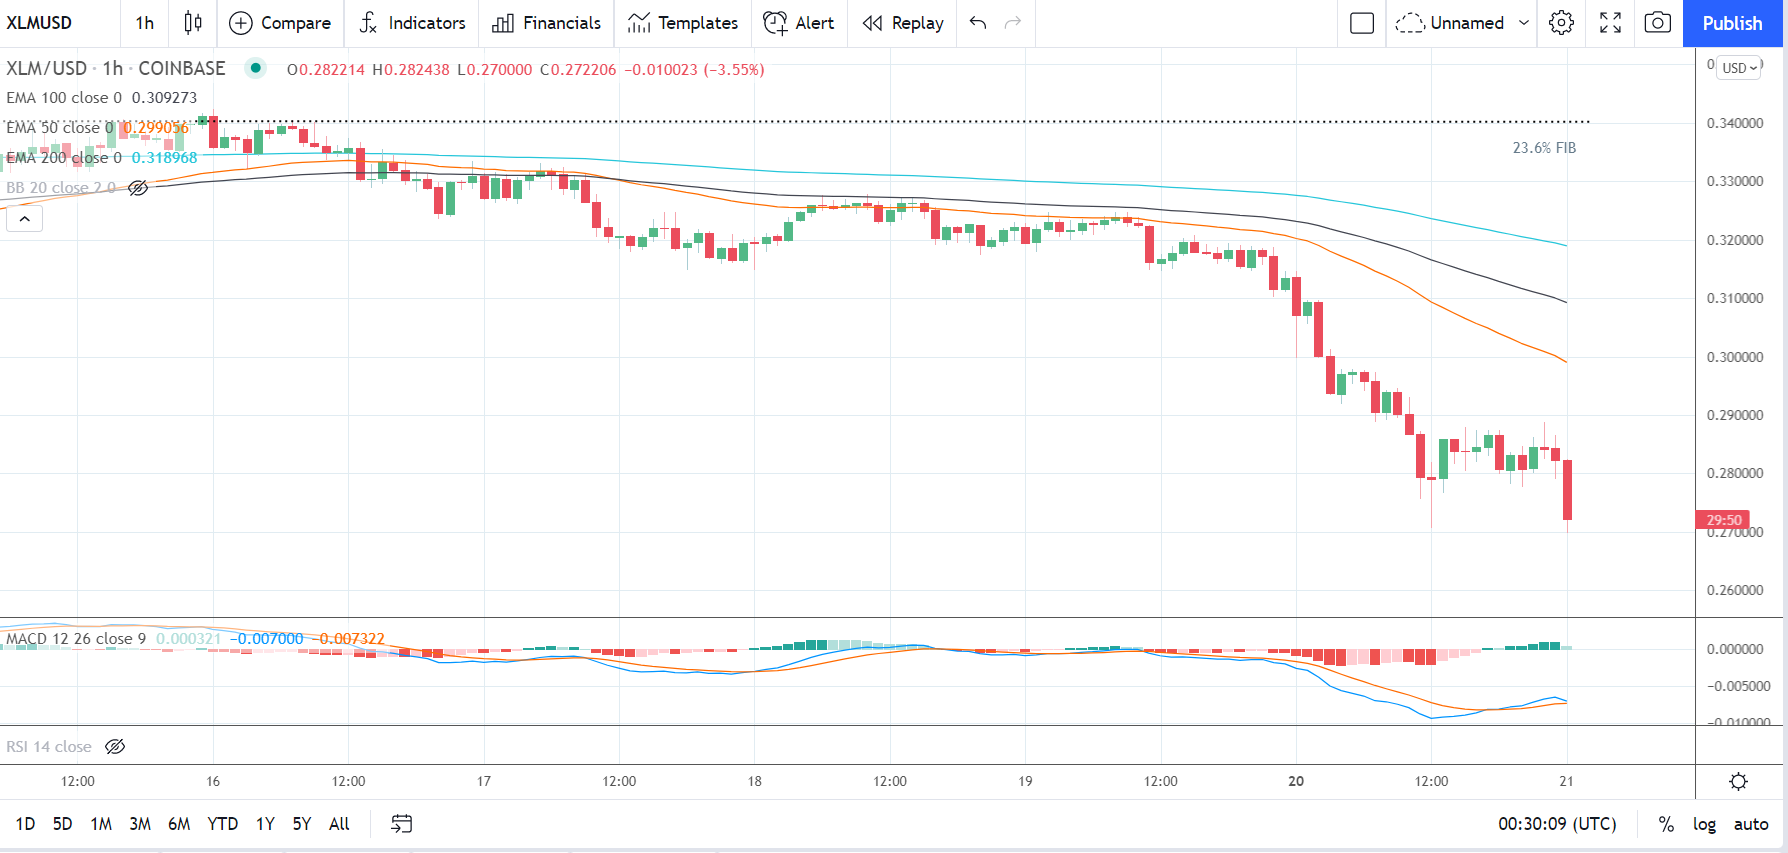
Stellar’s Lumen slid by 9.98% on Monday. Following a 2.73% fall on Sunday, Stellar’s Lumen ended the day at $0.2822.
A mixed start to the day saw Stellar’s Lumen rise to an early morning intraday high $0.3147 before hitting reverse.
Falling short of the first major resistance level at $0.3162, Stellar’s Lumen fell to a mid-day intraday low $0.2708.
Stellar’s Lumen fell through the day’s major support levels.
Finding late support, Stellar’s Lumen ended the day at $0.28 levels.
Late in the day, the third major support level at $0.2874 pegged Stellar’s Lumen back, however.
At the time of writing, Stellar’s Lumen was down by 3.55% to $0.2722. A mixed start to the day saw Stellar’s Lumen rise to an early morning high $0.2824 before falling to a low $0.2700.
Stellar’s Lumen left the major support and resistance levels untested early on.
For the day ahead
Stellar’s Lumen would need to move through the $0.2892 pivot to bring the first major resistance level at $0.3077 into play.
Support from the broader market would be needed, however, for Stellar’s Lumen to break back through to $0.30 levels.
Barring an extended rally, the first major resistance level would likely cap the upside.
In the event of a broad-based crypto rally, Stellar’s Lumen could test resistance at $0.32 levels. The second major resistance level sits at $0.3331.
Failure to move through the $0.2892 pivot would bring the first major support level at $0.2638 into play.
Barring another extended sell-off on the day, Stellar’s Lumen should steer clear of sub-$0.25 levels. The second major support level sits at $0.2453.
Looking at the Technical Indicators
First Major Support Level: $0.2638
First Major Resistance Level: $0.3077
23.6% FIB Retracement Level: $0.
38% FIB Retracement Level: $0.4277
62% FIB Retracement Level: $0.5690
Tron’s TRX
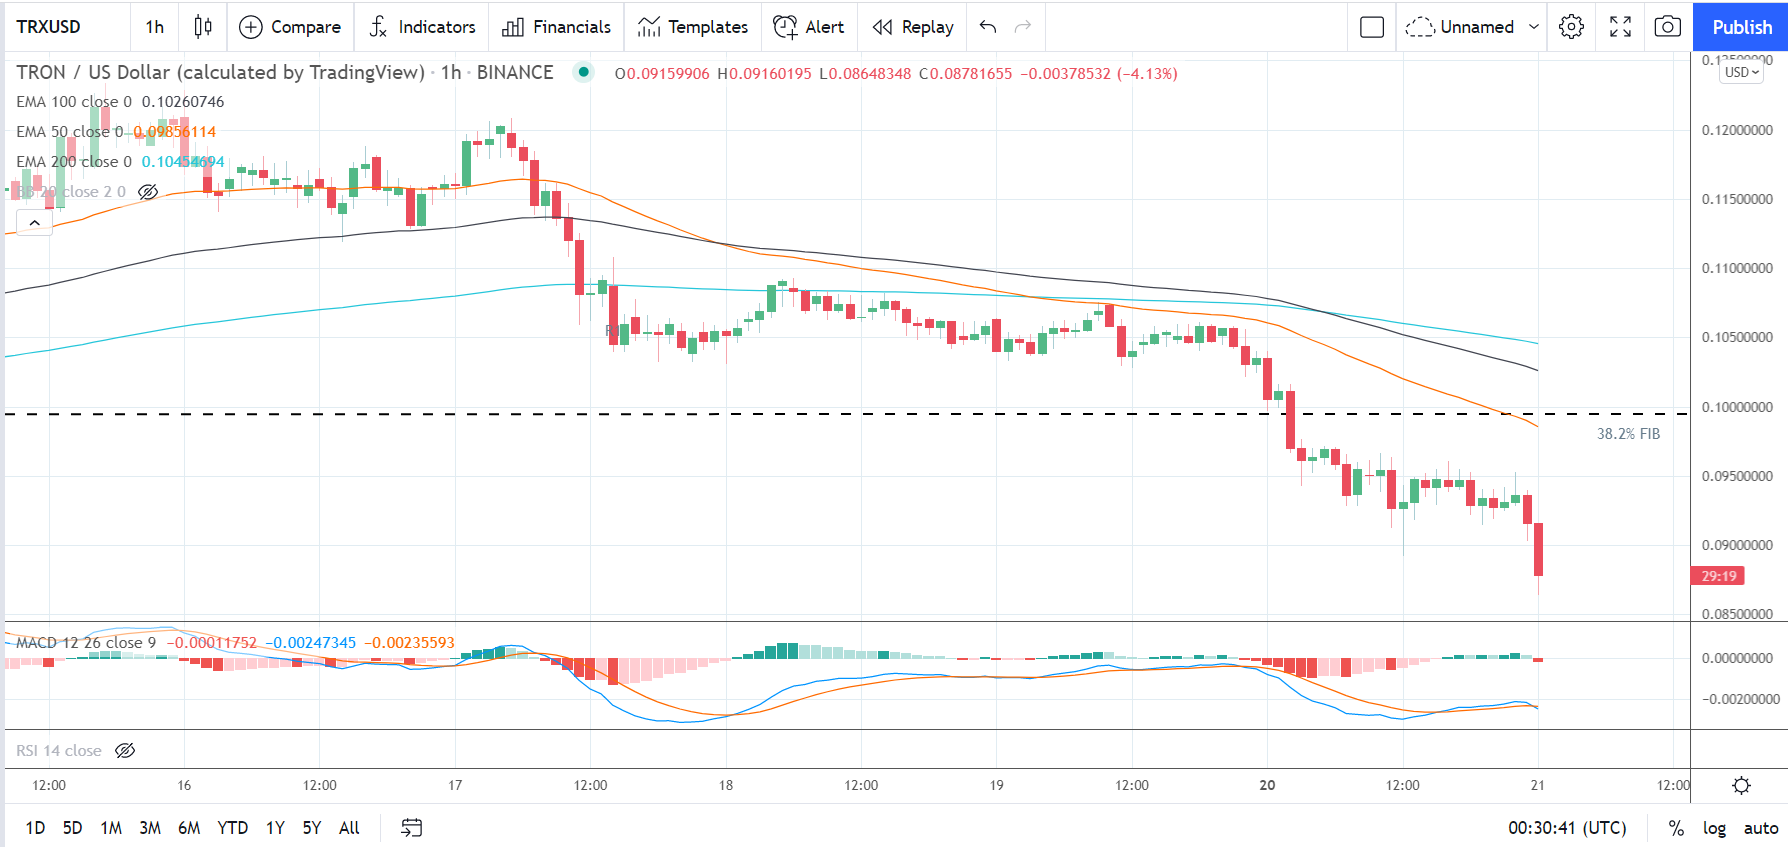
Tron’s TRX tumbled by 11.50% on Monday. Following a 2.17% loss on Sunday, Tron’s TRX ended the day at $0.09160.
A mixed start to the day saw Tron’s TRX rise to an early morning intraday high $0.1041 before hitting reverse.
Falling short of the first major resistance level at $0.1066, Tron’s TRX fell to a mid-day intraday low $0.08929.
The sell-off saw Tron’s TRX fall through the day’s major support levels.
More significantly, Tron’s TRX also fell through the 38.2% FIB of $0.09890 to end the day at $0.091 levels.
At the time of writing, Tron’s TRX was down by 4.13% to $0.08782. A mixed start to the day saw Tron’s TRX rise to an early morning high $0.09160 before falling to a low $0.08648.
Tron’s TRX left the major support and resistance levels untested early on.
For the Day Ahead
Tron’s TRX would need to move through the $0.09500 pivot to bring the 38.2% FIB of $0.09890 and the first major resistance level at $0.1007 into play.
Support from the broader market would be needed, however, for Tron’s TRX to break back through to $0.10 levels.
Barring an extended crypto rally, the first major resistance level and Monday’s high $0.1041 would likely cap the upside.
In the event of a broad-based crypto rally, Tron’s TRX could test resistance at $0.11 levels before any pullback. The second major resistance level sits at $0.1098.
Failure to move through $0.09500 pivot would bring the first major support level at $0.08589 into play.
Barring an extended sell-off, however, Tron’s TRX should steer clear of the 23.6% FIB of $0.07870. The second major support level at $0.08019 should limit the downside.
Looking at the Technical Indicators
First Major Support Level: $0.08589
First Major Resistance Level: $0.1007
23.6% FIB Retracement Level: $0.0787
38.2% FIB Retracement Level: $0.0989
62% FIB Retracement Level: $0.1316
Please let us know what you think in the comments below
Thanks, Bob
About the Author
Bob Masonauthor
With over 20 years of experience in the finance industry, Bob has been managing regional teams across Europe and Asia and focusing on analytics across both corporate and financial institutions. Currently he is covering developments relating to the financial markets, including currencies, commodities, alternative asset classes, and global equities.
Did you find this article useful?
Latest news and analysis


Advertisement