- USD/CNH holds lower ground, drops the most in a week.
- Bullish MACD, sustained trading above 200-DMA challenge bears.
- PBOC moves, Evergande headlines favored sellers ahead of Fed.
USD/CNH battles key support to extend the pullback from the monthly top, down 0.11% intraday around $6.4750 ahead of Wednesday’s European session.
In doing so, the offshore Chinese currency (CNH) pair struggles to portray the optimism surrounding Evergande and the People’s Bank of China (PBOC) amid pre-Fed caution.
Read: AUD/USD snaps four-day downtrend near 0.7250 on PBOC news, focus on Evergrande, Fed
Technically, the quote remains pressured between a downward sloping trend line from late July and 200-DMA, respectively around $6.4875 and $6.4730.
Even as 23.6% Fibonacci retracement of May-July upside adds strength to the upside hurdle, USD/CNH failures to break the 200-DMA level of $6.4730 joins bullish MACD signals to keep buyers hopeful.
However, a clear upside break of $6.4875 becomes necessary to witness the advances targeting August month’s top near $6.5100.
While the $6.5000 round figure may offer an intermediate halt during the anticipated upside, the yearly peak marked in July around $6.5285 will lure the pair buyers afterward.
Alternatively, 38.2% and 50% Fibonacci retracement levels, respectively around $6.4600 and $6.4400, will be on the USD/CNH bear’s radar on the break of $6.4875 support.
In a case where the quote remains heavy past $6.4400, the monthly bottom near $6.4250-45 will be in focus.
USD/CNH: Daily chart
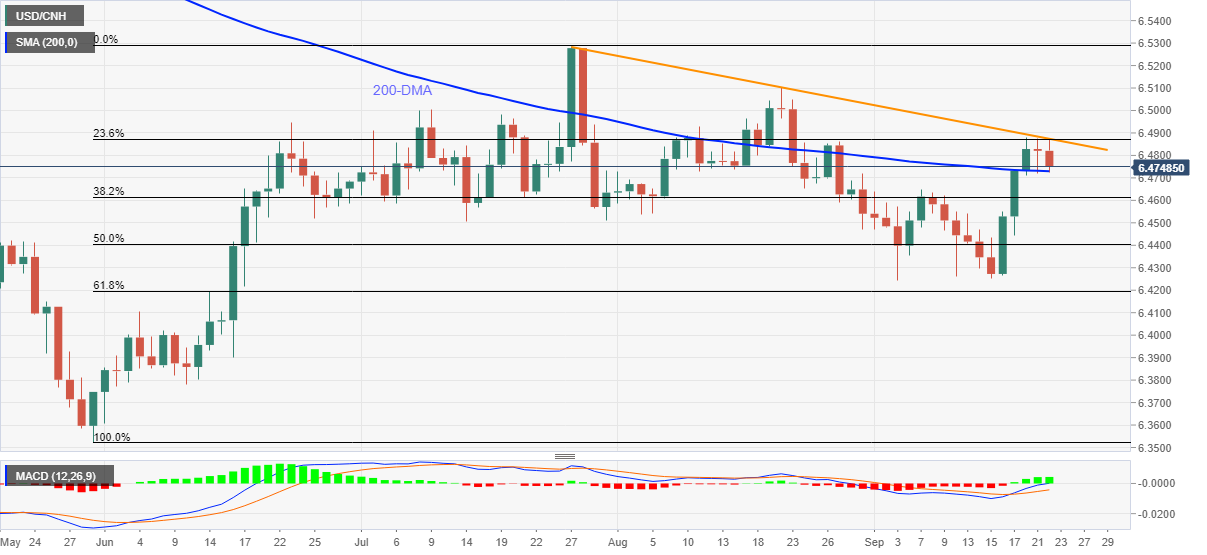
Trend: Bullish
Information on these pages contains forward-looking statements that involve risks and uncertainties. Markets and instruments profiled on this page are for informational purposes only and should not in any way come across as a recommendation to buy or sell in these assets. You should do your own thorough research before making any investment decisions. FXStreet does not in any way guarantee that this information is free from mistakes, errors, or material misstatements. It also does not guarantee that this information is of a timely nature. Investing in Open Markets involves a great deal of risk, including the loss of all or a portion of your investment, as well as emotional distress. All risks, losses and costs associated with investing, including total loss of principal, are your responsibility. The views and opinions expressed in this article are those of the authors and do not necessarily reflect the official policy or position of FXStreet nor its advertisers. The author will not be held responsible for information that is found at the end of links posted on this page.
If not otherwise explicitly mentioned in the body of the article, at the time of writing, the author has no position in any stock mentioned in this article and no business relationship with any company mentioned. The author has not received compensation for writing this article, other than from FXStreet.
FXStreet and the author do not provide personalized recommendations. The author makes no representations as to the accuracy, completeness, or suitability of this information. FXStreet and the author will not be liable for any errors, omissions or any losses, injuries or damages arising from this information and its display or use. Errors and omissions excepted.
The author and FXStreet are not registered investment advisors and nothing in this article is intended to be investment advice.
Recommended content
Editors’ Picks
EUR/USD retreats below 1.0700 after US GDP data

EUR/USD came under modest bearish pressure and retreated below 1.0700. Although the US data showed that the economy grew at a softer pace than expected in Q1, strong inflation-related details provided a boost to the USD.
GBP/USD declines below 1.2500 as USD rebounds

GBP/USD declined below 1.2500 and erased the majority of its daily gains with the immediate reaction to the US GDP report. The US economy expanded at a softer pace than expected in Q1 but the price deflator jumped to 3.4% from 1.8%.
Gold drops below $2,320 as US yields shoot higher

Gold lost its traction and turned negative on the day below $2,320 in the American session on Thursday. The benchmark 10-year US Treasury bond yield is up more than 1% on the day above 4.7% after US GDP report, weighing on XAU/USD.
XRP extends its decline, crypto experts comment on Ripple stablecoin and benefits for XRP Ledger

Ripple extends decline to $0.52 on Thursday, wipes out weekly gains. Crypto expert asks Ripple CTO how the stablecoin will benefit the XRP Ledger and native token XRP.
After the US close, it’s the Tokyo CPI

After the US close, it’s the Tokyo CPI, a reliable indicator of the national number and then the BoJ policy announcement. Tokyo CPI ex food and energy in Japan was a rise to 2.90% in March from 2.50%.