
Advertisement
Advertisement
EUR/USD Mid-Session Technical Analysis for September 23, 2021
By:
The direction of the EUR/USD on Thursday is being controlled by 1.1690.

In this article:
The Euro is trading higher against the U.S. Dollar on Thursday as improved risk sentiment in global financial markets erased all the gains it notched in the previous session after the U.S. Federal Reserve flagged plans to reel in stimulus this year. A rise in U.S. Treasury yields is helping to cap gains.
AT 04:56 GMT, the EUR/USD is trading 1.1742, up 0.0052 or +0.45%.
In other news, the dollar found little support from data that showed the number of Americans filing new claims for jobless benefits unexpectedly rose last week amid a surge in California.
Additionally, while positive for the dollar, the boost from the Fed’s announcement was undercut by hawkish messages from several central banks in Europe, and as Norway became the first developed nation to raise rates.
Daily Swing Chart Technical Analysis
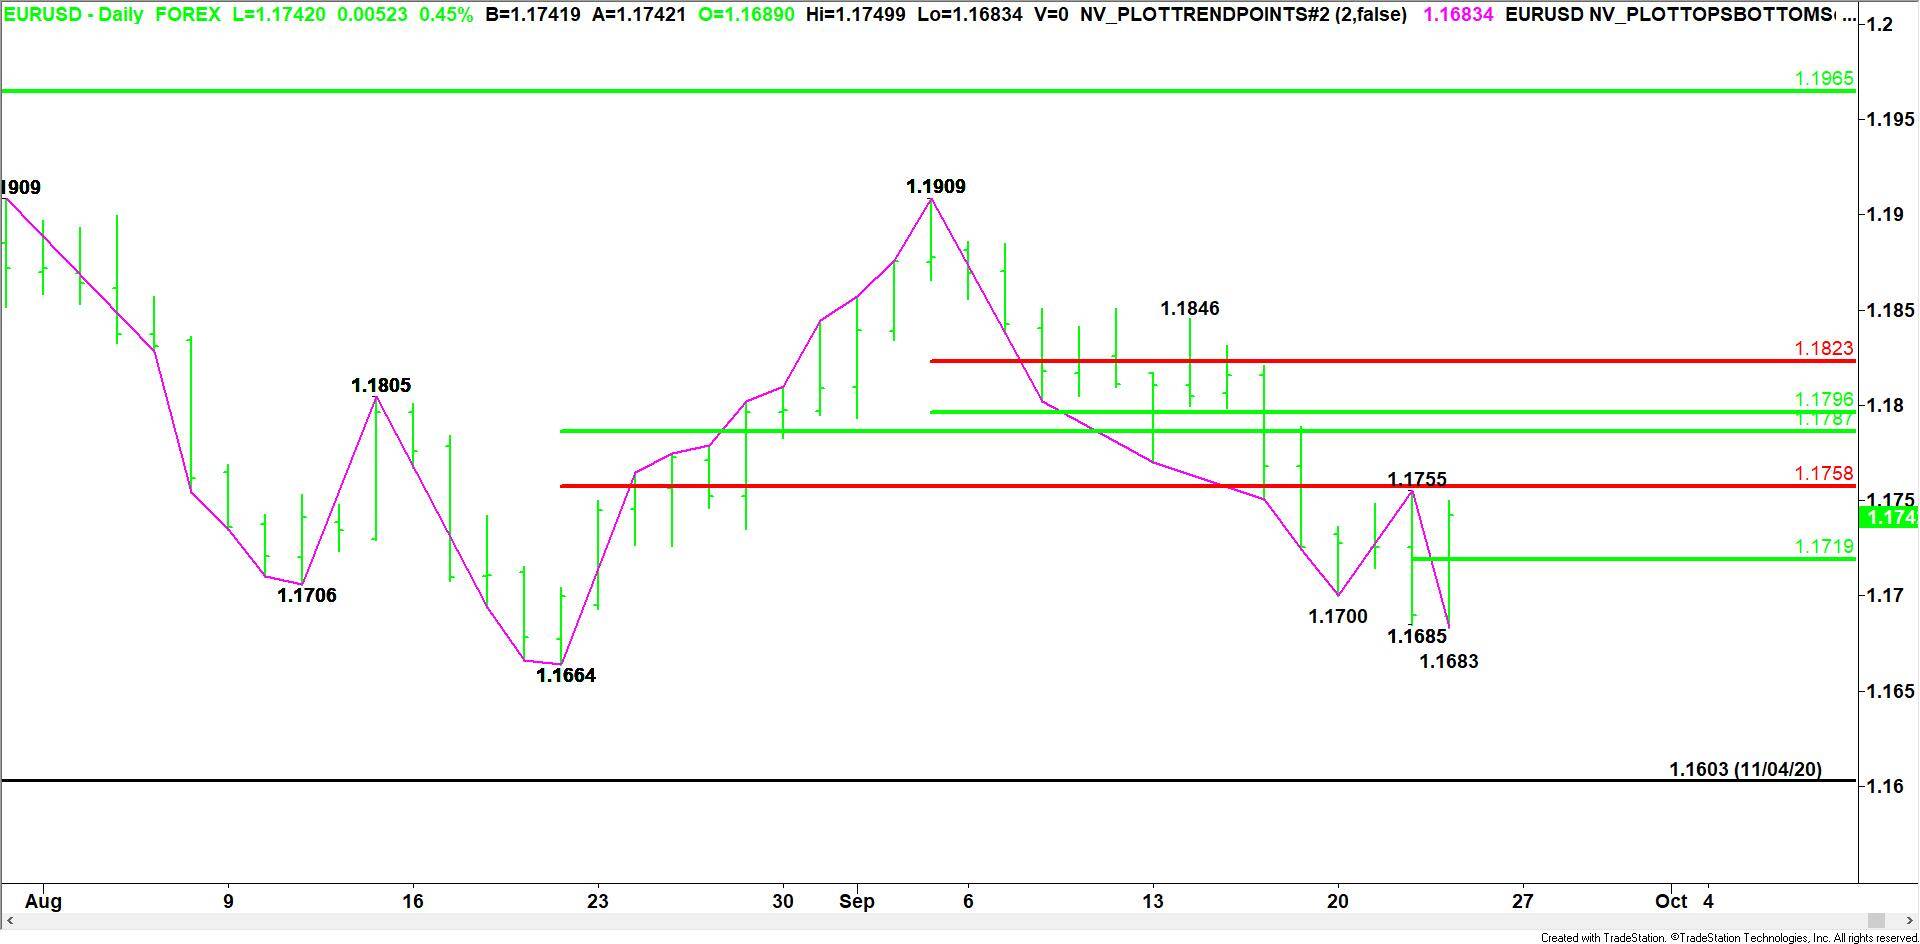
The main trend is down according to the daily swing chart. A trade through 1.1755 will change the main trend to up. A move through 1.1683 will signal a resumption of the downtrend.
The minor range is 1.1685 to 1.1755. In a sign of strength, the EUR/USD is currently trading on the strong side of its pivot at 1.1719, making it support.
The first short-term range is 1.1664 to 1.1909. Its retracement zone at 1.1758 to 1.1787 is resistance.
The second short-term range is 1.1909 to 1.1683. Its retracement zone at 1.1796 to 1.1823 is additional resistance.
Daily Swing Chart Technical Forecast
The direction of the EUR/USD on Thursday is being controlled by 1.1690.
Bullish Scenario
A sustained move over 1.1690 will put the EUR/USD in a position to post a potentially bullish closing price reversal bottom. Holding above the pivot at 1.1719 indicates the buying is getting stronger.
Taking out 1.1755 will change the main trend to up. A move through the Fibonacci level at 1.1758 will indicate the buying is getting stronger. This could trigger an acceleration to the upside with the resistance cluster at 1.1787 to 1.1796 the next likely upside target.
Bearish Scenario
The inability to overcome 1.1755 will be the first sign of selling pressure. This could trigger a break into the pivot at 1.1719. Taking out this level will indicate the selling pressure is getting stronger. This could trigger a retest of the intraday low at 1.1683.
For a look at all of today’s economic events, check out our economic calendar.
About the Author
James Hyerczykauthor
James is a Florida-based technical analyst, market researcher, educator and trader with 35+ years of experience. He is an expert in the area of patterns, price and time analysis as it applies to futures, Forex, and stocks.
Did you find this article useful?
Latest news and analysis


Advertisement