
Today’s Chart: Gold Breakout Coming?
Sometimes it helps to zoom out a bit.
For gold (at least when priced in US dollars), the past few years’ action has seemed boring, one might even say directionless. But move the starting date back and flip the graphical relationship between metal and currency, as Stewart Thompson recently did, and the picture looks a lot more dramatic:
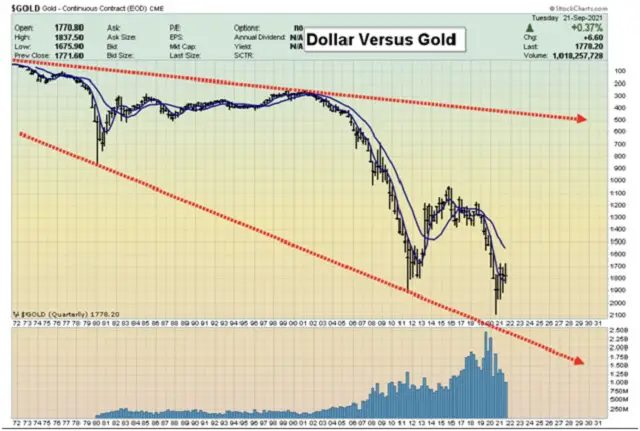
Since the US took the world off the last vestiges of the gold standard in 1971, the general trend for gold priced in dollars has been up (which on the above chart is represented as downward movement). Said another way, the dollar has been falling versus gold.
That’s not a secret, of course, but note how close gold is to its multidecade channel. Peircing $2,200 would do massive technical damage to the dollar and leave gold with a lot of room to run.
Prediction: This breakthrough happens on the day the Fed retracts its recent tapering talk and promises easy money forever. Early next year, in other words.


