
Advertisement
Advertisement
Gold Price Futures (GC) Technical Analysis – Strengthens Over $1757.40, Weakens Under $1738.60
By:
The direction of the December Comex gold futures contract on Friday is likely to be determined by trader reaction to $1757.40.

In this article:
Gold futures are edging higher early Friday on short-covering ahead of the weekend, one-day after the market posted a more than 1% decline. Despite the early strength, the market is still poised to finish lower for the week.
Safe-haven buyers who took positions earlier in the week on concerns over China Evergrande’s debt woes dumped gold as worries over the company’s imminent default eased.
At 06:16 GMT, December Comex gold settled at $1755.50, up $5.70 or +0.33%.
Today’s early rebound reflects the two-sided action in U.S. Treasury yields and the U.S. Dollar. The direction gold the rest of the session on Friday will be driven primarily by the movement in yields and to a lesser extent by the U.S. Dollar.
I don’t anticipate any major movement to the upside, however, because of the hawkish tone by the Federal Reserve earlier in the week.
Daily Swing Chart Technical Analysis
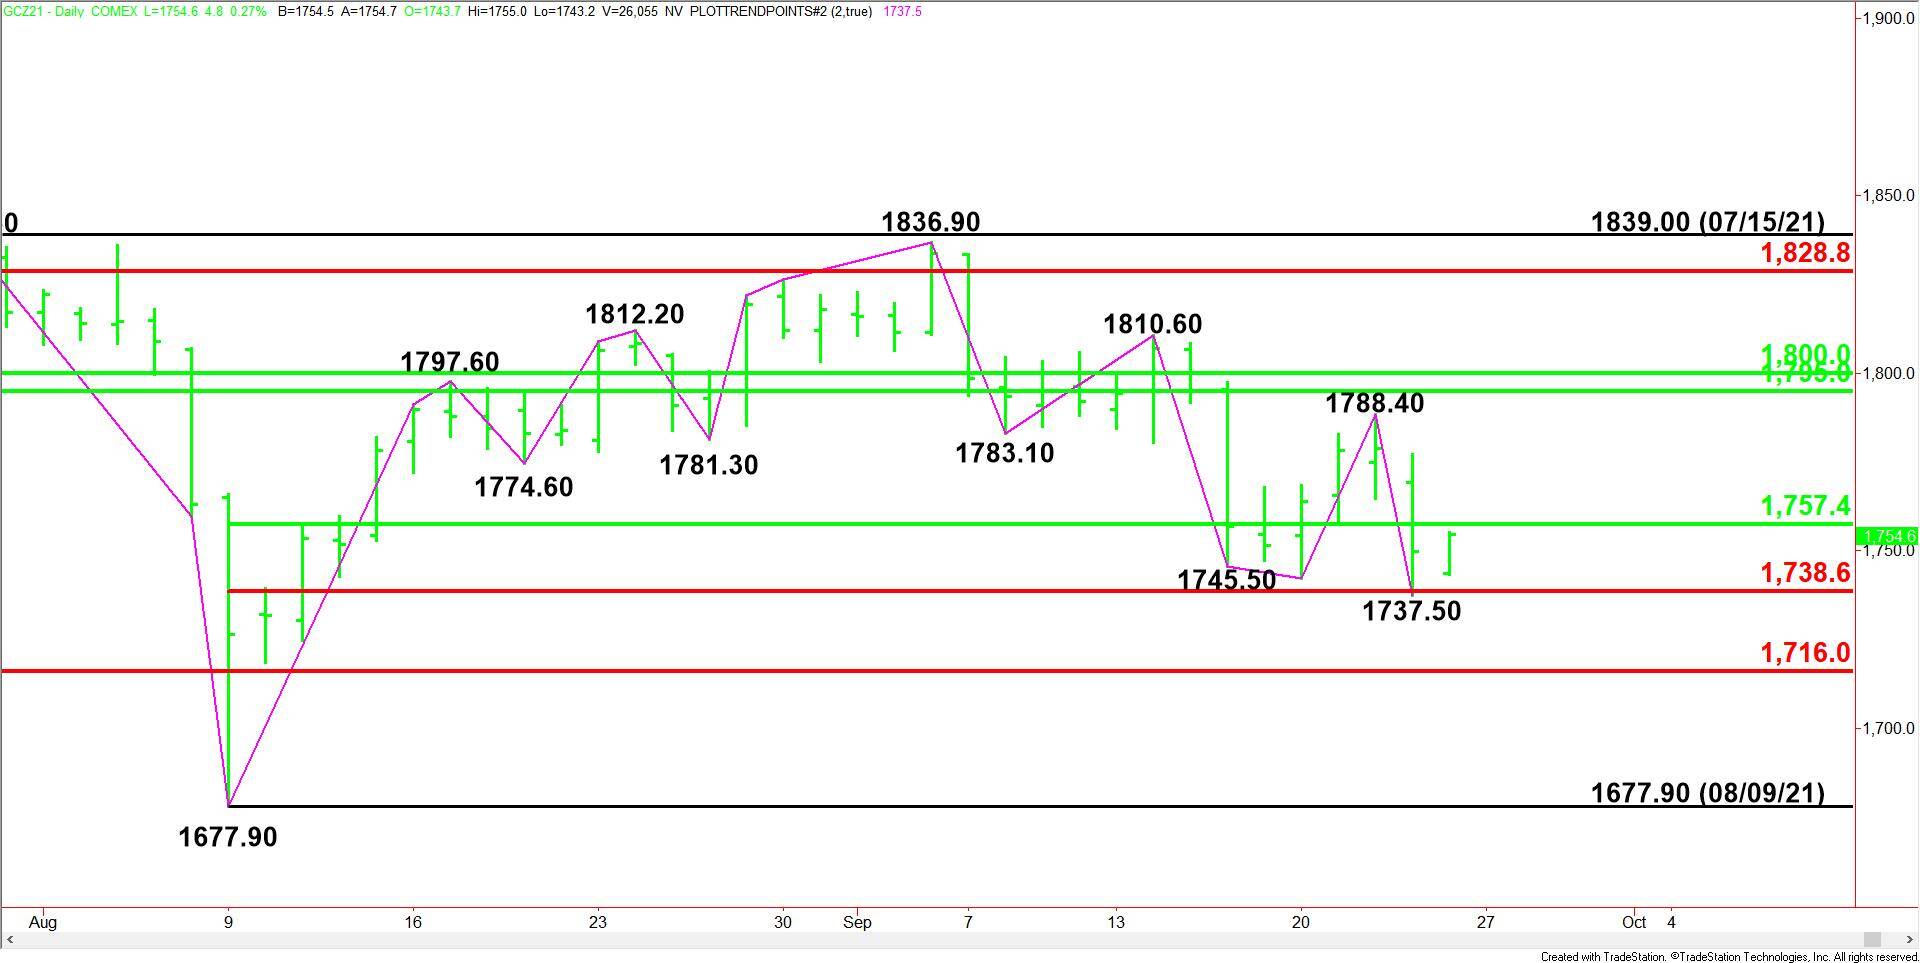
The main trend is down according to the daily swing chart. A trade through $1737.50 will signal a resumption of the downtrend. The main trend will change to up on a move through $1788.40.
The short-term range is $1677.90 to $1836.90. The market is currently trading inside its retracement zone at $1757.40 to $1738.60.
On the downside, the major support is a Fibonacci level at $1716.00. On the upside, the major resistance is a pair of 50% levels at $1795.00 to $1800.00.
Daily Swing Chart Technical Forecast
The direction of the December Comex gold futures contract on Friday is likely to be determined by trader reaction to $1757.40.
Bullish Scenario
A sustained move over $1757.40 will indicate the presence of buyers. If this move is able to generate enough upside momentum then look for the rally to possibly extend into a main top at $1788.40, and a pair of 50% levels at $1795.00 and $1800.00.
Bearish Scenario
A sustained move under $1757.40 will signal the presence of sellers. This could trigger a break into a support cluster at $1738.60 to $1737.50.
Taking out $1737.50 will indicate the selling pressure is getting stronger. This could trigger a further break into the major Fibonacci level at $1716.00.
For a look at all of today’s economic events, check out our economic calendar.
About the Author
James Hyerczykauthor
James is a Florida-based technical analyst, market researcher, educator and trader with 35+ years of experience. He is an expert in the area of patterns, price and time analysis as it applies to futures, Forex, and stocks.
Did you find this article useful?
Latest news and analysis


Advertisement