
Advertisement
Advertisement
Gold Price Prediction – Prices Rebound Slightly Despite Rising Yields
By:
The dollar rallied

Gold prices moved higher on Friday, despite a stable dollar and rising yields. The greenback was able to gain traction as yields surged higher in the wake of the Fed’s commentary. Despite softer than expected PMI and Jobless claims data released on Thursday, the Fed’s message that they will begin to taper bond purchases by the end of the year. The market is now pricing in a 25-basis point hike by September of 2022, and a 50% chance of a second hike by December 2022. Higher yields will help buoy the dollar which should eventually weigh on the yellow metal.

Regulated By:FCA, CySEC , FSCA, FSCM
Headquarters:Cyprus
Foundation Year:2011
Min Deposit:$500
82% of retail CFD accounts lose money
Demo Account:Open Demo Account
Max Leverage:1:30 (FCA), 1:30 (CySEC ), 1:500 (FSCA), 1:3000 (FSCM)
Publicly Traded:No
Deposit Options:Wire Transfer, Credit Card, Skrill, Neteller, , Local Deposit, , Maestro, Visa, Mastercard
Withdrawal Options:Wire Transfer, Credit Card, Skrill, Neteller, Mastercard, , , PerfectMoney, Maestro, Visa
Products:Currencies, Commodities, Indices, Stocks
Trading Platforms:MT4, MT5, ,
Trading Desk Type:No dealing desk, ECN, Market Maker
OS Compatability:Desktop platform (Windows), Desktop platform (Mac), Web platform
Mobile Trading Options:Android, iOS
Technical analysis
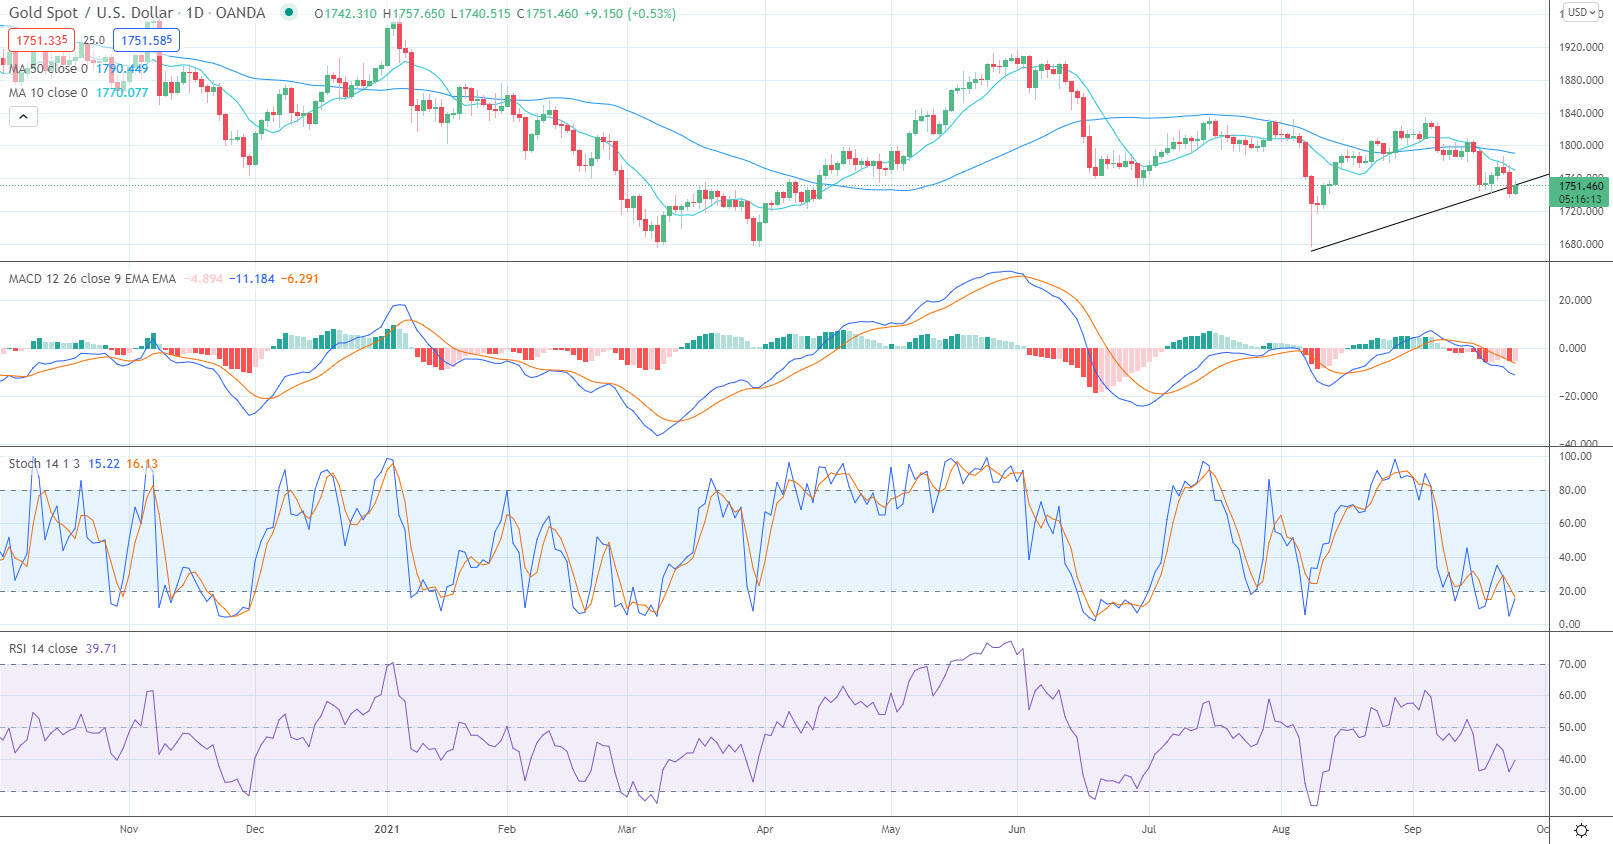
Gold prices rebounded slightly but the bear flag pattern is in place. This pattern is a continuation event that pauses before it refreshes lower. Prices remained below resistance seen near the 10-day moving average, at 1,770. Target support is seen near the August lows at 1,677. The 10-day moving average has crossed below the 50-day moving average, which means that a short-term downtrend is now in place. Short-term momentum has reversed and turned negative as the fast stochastic generated a crossover sell signal.
Medium-term momentum has turned negative as the MACD (moving average convergence divergence) index generated a crossover signal. This sell signal occurs as the MACD line (the 12-day moving average minus the 26-day moving average) crosses above the MACD signal line (the 9-day moving average of the MACD line). The MACD histogram is printing in negative territory with a downward sloping trajectory which points to lower prices.
About the Author
David Beckerauthor
David Becker focuses his attention on various consulting and portfolio management activities at Fortuity LLC, where he currently provides oversight for a multimillion-dollar portfolio consisting of commodities, debt, equities, real estate, and more.
Did you find this article useful?
Latest news and analysis


Advertisement