Published
2 years ago on
September 24, 2021
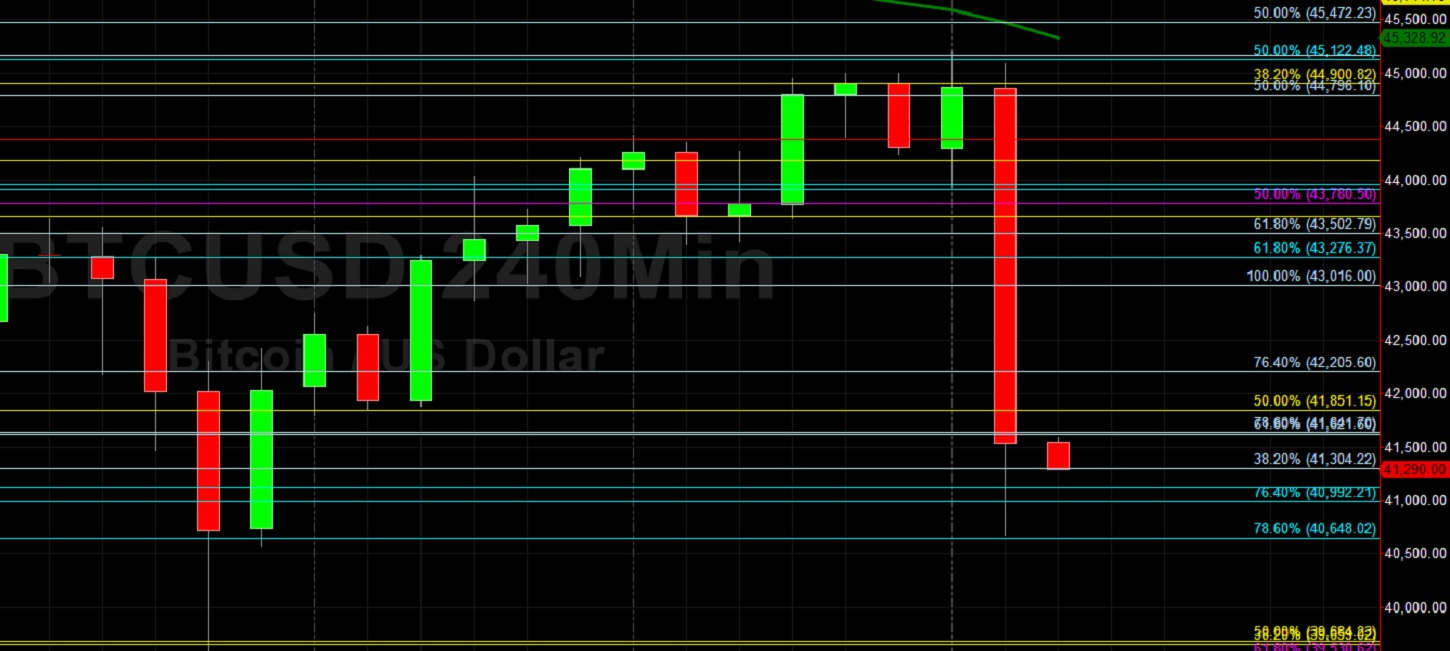
Bitcoin (BTC/USD) extended its weakness early in the Asian session as the pair continued to experience negative technical sentiment after being driven back below the 41000 figure following a failure around the 45200 level during the European session, with the intraday high representing a test of the 23.6% retracement of the depreciating range from 52944.96 to 42830.77. Stops were elected below the 43878, 43060, 42400, 41739, 40921, and 40798 levels, retracement levels related to the recent appreciating range from 39600 to 45200. Buying pressure emerged around the 40683.29 level during the North American session, representing a test of the 78.6% retracement of the appreciating range from 37300 to 52944.96. Significant Stops were recently elected below the 40992.21 and 40648.02 levels during the move lower, representing the 76.4% and 78.6% retracements of the broad appreciating range from 37300 to 52944.96. Selling pressure intensified earlier this week, and additional Stops were elected below the 42666, 42140, 41456, and 40805 levels during the downturn.
After selling pressure that intensified around the 47788 and 45832 levels earlier this week, the 42668 area emerged as an important downside price objective, and buying pressure temporarily emerged just below this area to drive BTC/USD higher to the 44250.35 level before selling pressure resumed. Following the recent selling pressure, upside retracement levels and areas of potential technical resistance include 43994, 44889, 45997, and 46164 levels. Traders are observing that the 50-bar MA (4-hourly) is bearishly indicating below the 100-bar MA (4-hourly) and below the 200-bar MA (4-hourly). Also, the 50-bar MA (hourly) is bearishly indicating below the 200-bar MA (hourly) and above the 100-bar MA (hourly).
Price activity is nearest the 50-bar MA (4-hourly) at 45471.29 and the 100-bar MA (Hourly) at 43275.68.
Technical Support is expected around 39600/ 37401.27/ 34881.40 with Stops expected below.
Technical Resistance is expected around 53025.00/ 54088.38/ 55841.04 with Stops expected above.
On 4-Hourly chart, SlowK is Bearishly below SlowD while MACD is Bullishly above MACDAverage.
On 60-minute chart, SlowK is Bearishly below SlowD while MACD is Bearishly below MACDAverage.
Disclaimer: This trading analysis is provided by a third party, and for informational purposes only. It does not reflect the views of Crypto Daily, nor is it intended to be used as legal, tax, investment, or financial advice.
Investment DisclaimerFoundation: A New Trading Paradigm
Bitrue to List Hummingbot Governance Token (HBOT)