
Coca Cola (KO) Building A Platform Of Support On The Daily Chart
(Click on image to enlarge)
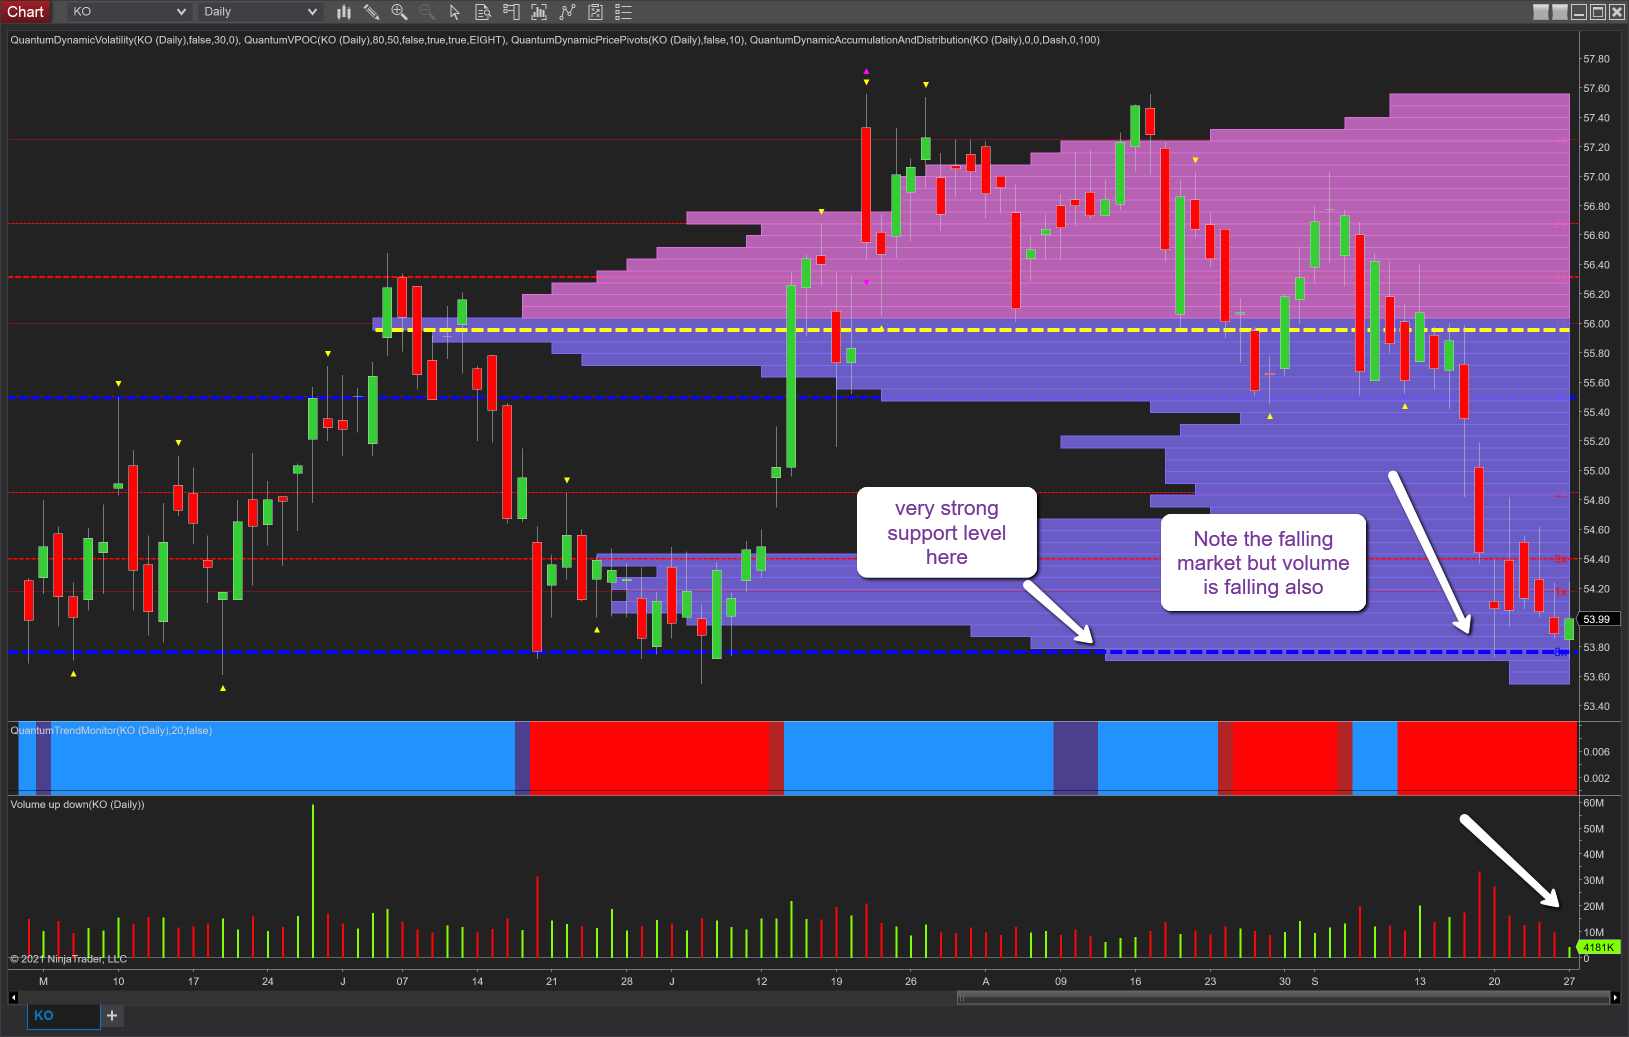
The daily chart for Coca-Cola (KO) is one that catches the eye at present from a technical perspective and is a stock I have analyzed extensively over the years. In my last analysis, the stock was trading at the $52 per share level and looking for a move higher, which did indeed occur taking the price to $57.50 and building a strong area of resistance at this level, before sliding lower, through the VPOC denoted with the yellow dashed line at $56 per share and down to today’s price of $54.03 at the time of writing. The fizz has definitely gone from this stock for the time being, so where next?
Well, the reason I’ve highlighted this one is twofold. First, we have a nice example of volume price analysis in the downtrend of the last few days, where we see volume falling in a falling market. This is one of the anomalies that new VPA students struggle to grasp. We are all familiar with gravity, and hence intuitively accept it takes effort to rise, and in a rising market, we also like to see rising volume. But just as it takes effort to rise, it also takes effort for a market to fall. In other words, we need to see volume in the same way. No market will fall far or fast if the volume is falling and hence the example here. The stock price has fallen from $55.50 down to the current level, but volume has fallen with it, signaling the selling pressure is waning. Second, we have an extremely strong platform of support at the $53.50 per share area as denoted by the blue dashed line of the accumulation and distribution indicator. The reason this line is thick is that it has been tested multiple times and held, as can be seen from May onwards. So clearly a significant level and not one to be ignored.
In summary, there is potential for the stock to rebound from this level and back to the VPOC in due course. However, one factor to consider is the vpoc histogram which at the current price level is almost as wide as the vpoc itself but will increase across the chart if the stock consolidates, in which case the current vpoc will move lower. Whether that will provide further support or not remains to be seen.
Disclaimer: Futures, stocks, and spot currency trading have large potential rewards, but also large potential risk. You must be aware of the risks and be willing to accept them in order to invest in ...
more

