
Advertisement
Advertisement
Ethereum, Litecoin, and Ripple’s XRP – Daily Tech Analysis – September 29th, 2021
By:
Following another bearish day for the majors, failure to revisit Tuesday's highs would likely deliver heavier losses on the day.

Ethereum
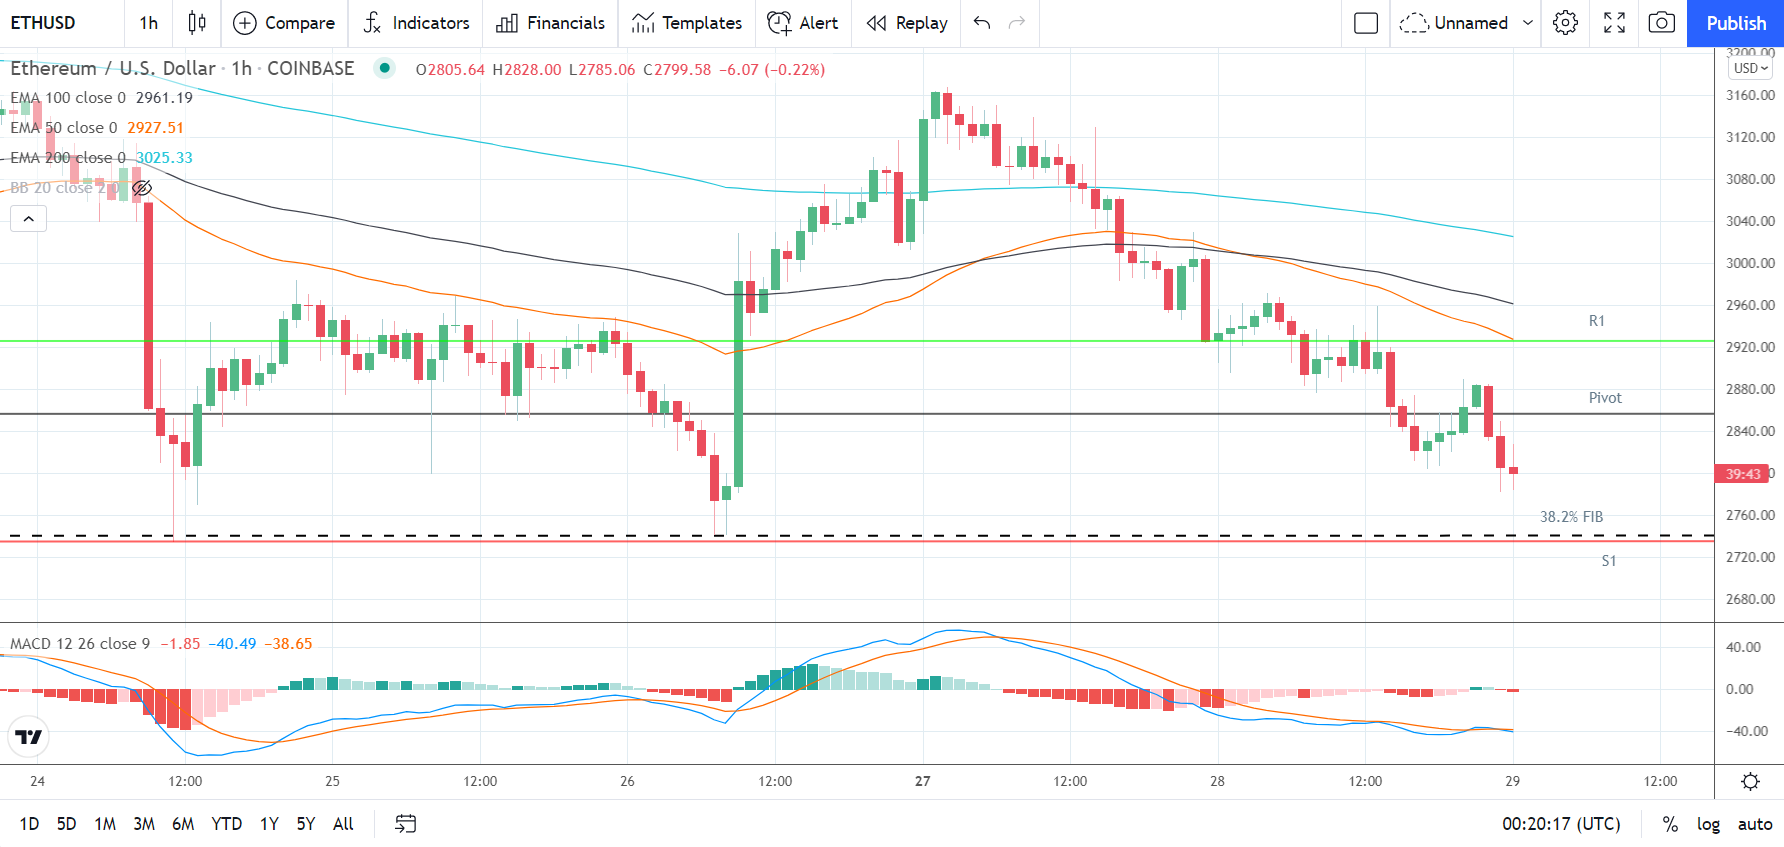
Ethereum fell by 4.12% on Tuesday. Following a 4.40% slide on Monday, Ethereum ended the day at $2,805.65.
A mixed start to the day saw Ethereum rise to an early morning intraday high $2,971.16 before hitting reverse.
Falling short of the first major resistance level at $3,087, Ethereum slid to a final hour intraday low $2,782.60.
Ethereum fell through the first major support level at $2,844 to end the day at $2,805 levels.
At the time of writing, Ethereum was down by 0.22% to $2,799.58. A mixed start to the day saw Ethereum rise to an early morning high $2,828.00 before falling to a low $2,785.06.
Ethereum left the major support and resistance levels untested early on.
For the day ahead
Ethereum would need to move through the $2,853 pivot to bring the first major resistance level at $2,924 into play.
Support from the broader market would be needed, however, for Ethereum to break back through to $2,900 levels.
Barring an extended crypto rally, the first major resistance level and Tuesday’s high $2,971.16 would likely cap the upside.
In the event of a broad-based crypto rally, Ethereum could test resistance at $3,100 before any pullback. The second major resistance level sits at $3,042.
Failure to move through the $2,853 pivot would bring the 38.2% FIB of $2,740 and the first major support level at $2,735 into play.
Barring another extended sell-off, however, Ethereum should steer clear of sub-$2,700 levels. The second major support level sits at $2,665.
Looking at the Technical Indicators
First Major Support Level: $2,735
Pivot Level: $2,853
First Major Resistance Level: $2,924
23.6% FIB Retracement Level: $3,369
38.2% FIB Retracement Level: $2,740
62% FIB Retracement Level: $1,725
Litecoin
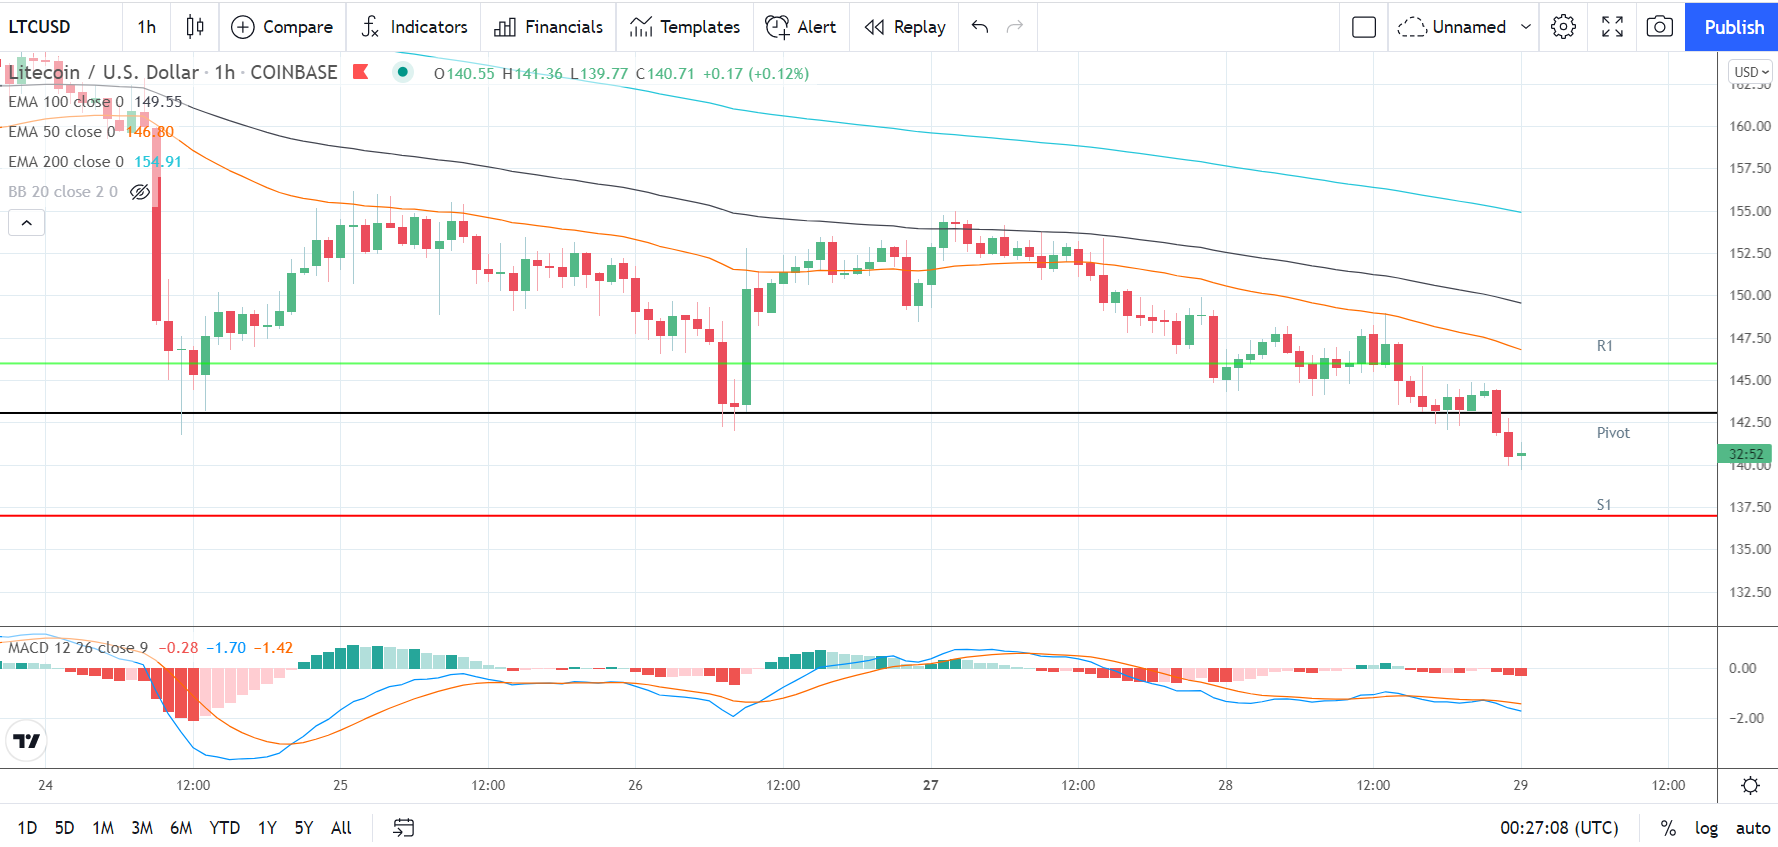
Litecoin fell by 3.12% on Tuesday. Following a 3.66% decline on Monday, Litecoin ended the day at $140.54.
After a choppy morning, Litecoin rose to an early afternoon intraday high $148.93 before hitting reverse.
Falling short of the first major resistance level at $152, Litecoin fell to a final hour intraday low $140.00.
Litecoin fell through the first major support level at $142 to end the day at $140 levels.
At the time of writing, Litecoin was up by 0.12% to $140.71. A mixed start to the day saw Litecoin rise to an early morning high $141.36 before falling to a low $139.77.
Litecoin left the major support and resistance levels untested early on.
For the day ahead
Litecoin would need to move through the $143 pivot to bring the first major resistance level at $146 into play.
Support from the broader market would be needed, however, for Litecoin to break back through to $145 levels.
Barring an extended crypto rally, the first major resistance level and Tuesday’s high $148.93 would likely cap the upside.
In the event of another breakout, Litecoin could test resistance at $155 before any pullback. The second major resistance level sits at $152.
Failure to move through the $143 pivot would bring the first major support level at $137 into play.
Barring another extended sell-off, Litecoin should steer clear of the second major support level at $134.
Looking at the Technical Indicators
First Major Support Level: $137
Pivot Level: $143
First Major Resistance Level: $146
23.6% FIB Retracement Level: $178
38.2% FIB Retracement Level: $223
62% FIB Retracement Level: $296
Ripple’s XRP
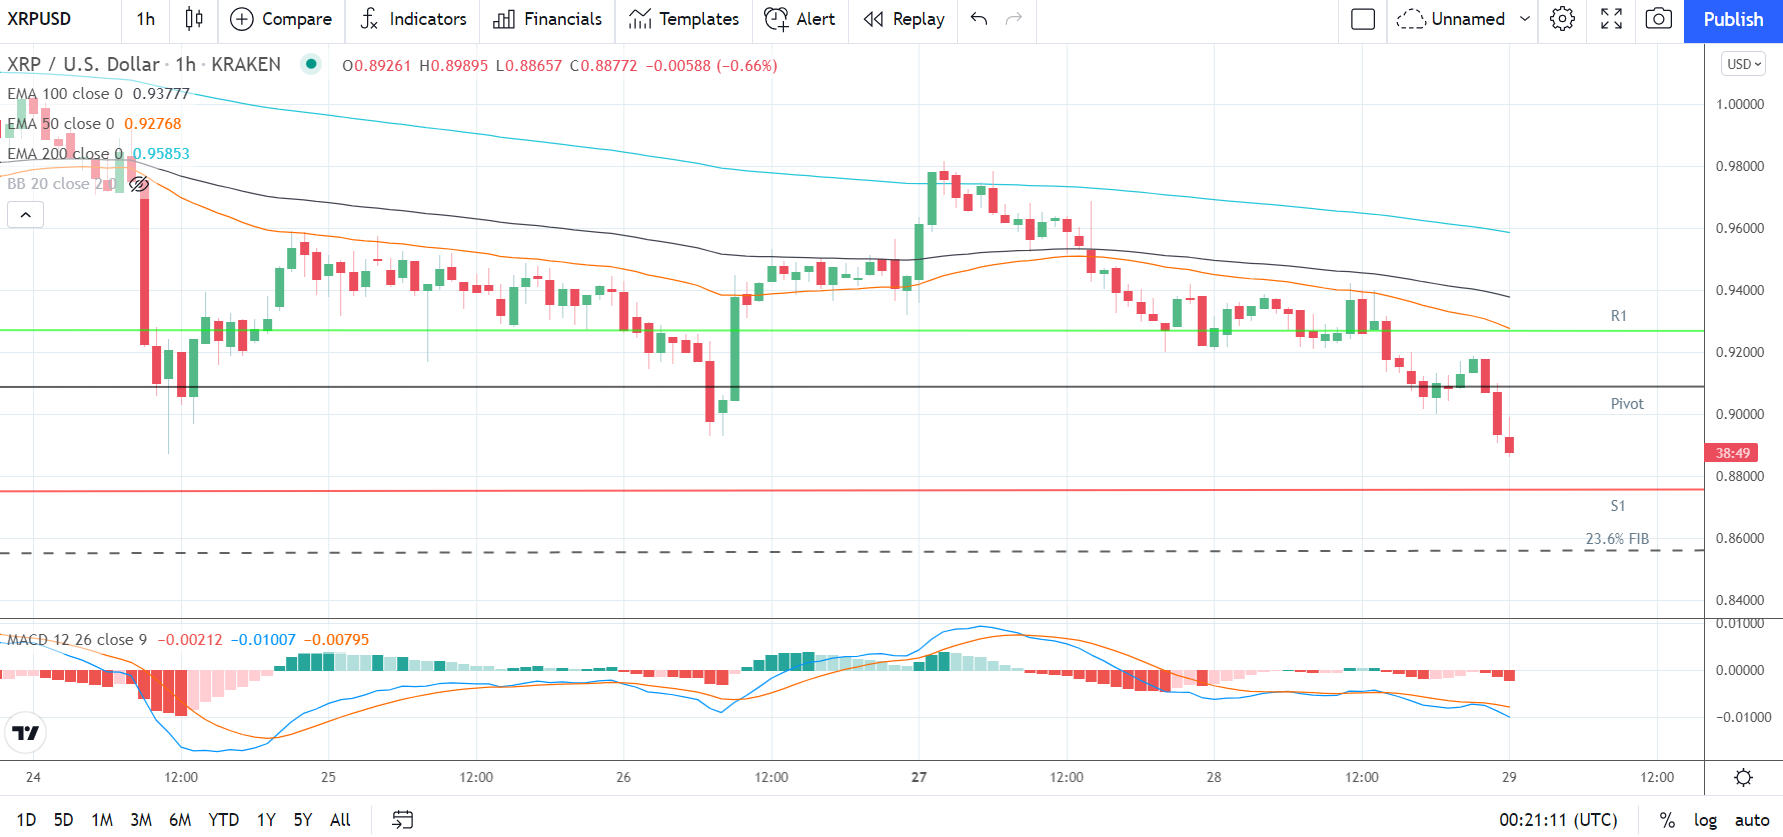
Ripple’s XRP fell by 3.07% on Tuesday. Following a 2.24% loss on Monday, Ripple’s XRP ended the day at $0.89360.
After a mixed start, Ripple’s XRP rose to a late morning intraday high $0.94242 before hitting reverse.
Falling short of the first major resistance level at $0.9626, Ripple’s XRP slid to a final hour intraday low $0.89115.
Ripple’s XRP fell through the first major support level at $0.9013 to end the day at sub-$0.90 levels.
At the time of writing, Ripple’s XRP was down by 0.66% to $0.88772. A mixed start to the day saw Ripple’s XRP rise to an early morning high $0.89895 before falling to a low $0.88657.
Ripple’s XRP left the major support and resistance levels untested early on.
For the day ahead
Ripple’s XRP would need to move through the $0.9091 pivot to bring the first major resistance level at $0.9270 into play.
Support would be needed, however, for Ripple’s XRP to break back through to $0.92 levels.
Barring an extended crypto rally, the first major resistance level and Tuesday’s high $0.94242 would likely cap the upside.
In the event of a broad-based crypto rally, Ripple’s XRP could test the second major resistance level at $0.9603.
Failure to move through $0.9091 pivot would bring the first major support level at $0.8757 into play.
Barring an extended sell-off, however, Ripple’s XRP should avoid the second major support level at $0.8578 and the 23.6% FIB of $0.8533.
Looking at the Technical Indicators
First Major Support Level: $0.8757
Pivot Level: $0.9091
First Major resistance Level: $0.9270
23.6% FIB Retracement Level: $0.8533
38.2% FIB Retracement Level: $1.0659
62% FIB Retracement Level: $1.4096
Please let us know what you think in the comments below.
Thanks, Bob
About the Author
Bob Masonauthor
With over 20 years of experience in the finance industry, Bob has been managing regional teams across Europe and Asia and focusing on analytics across both corporate and financial institutions. Currently he is covering developments relating to the financial markets, including currencies, commodities, alternative asset classes, and global equities.
Did you find this article useful?
Latest news and analysis


Advertisement