
Advertisement
Advertisement
EOS, Stellar’s Lumen, and Tron’s TRX – Daily Analysis – October 4th, 2021
By:
It was a bullish week for the majors last week. A revisit of Sunday's highs would signal a breakout day ahead.

In this article:
EOS
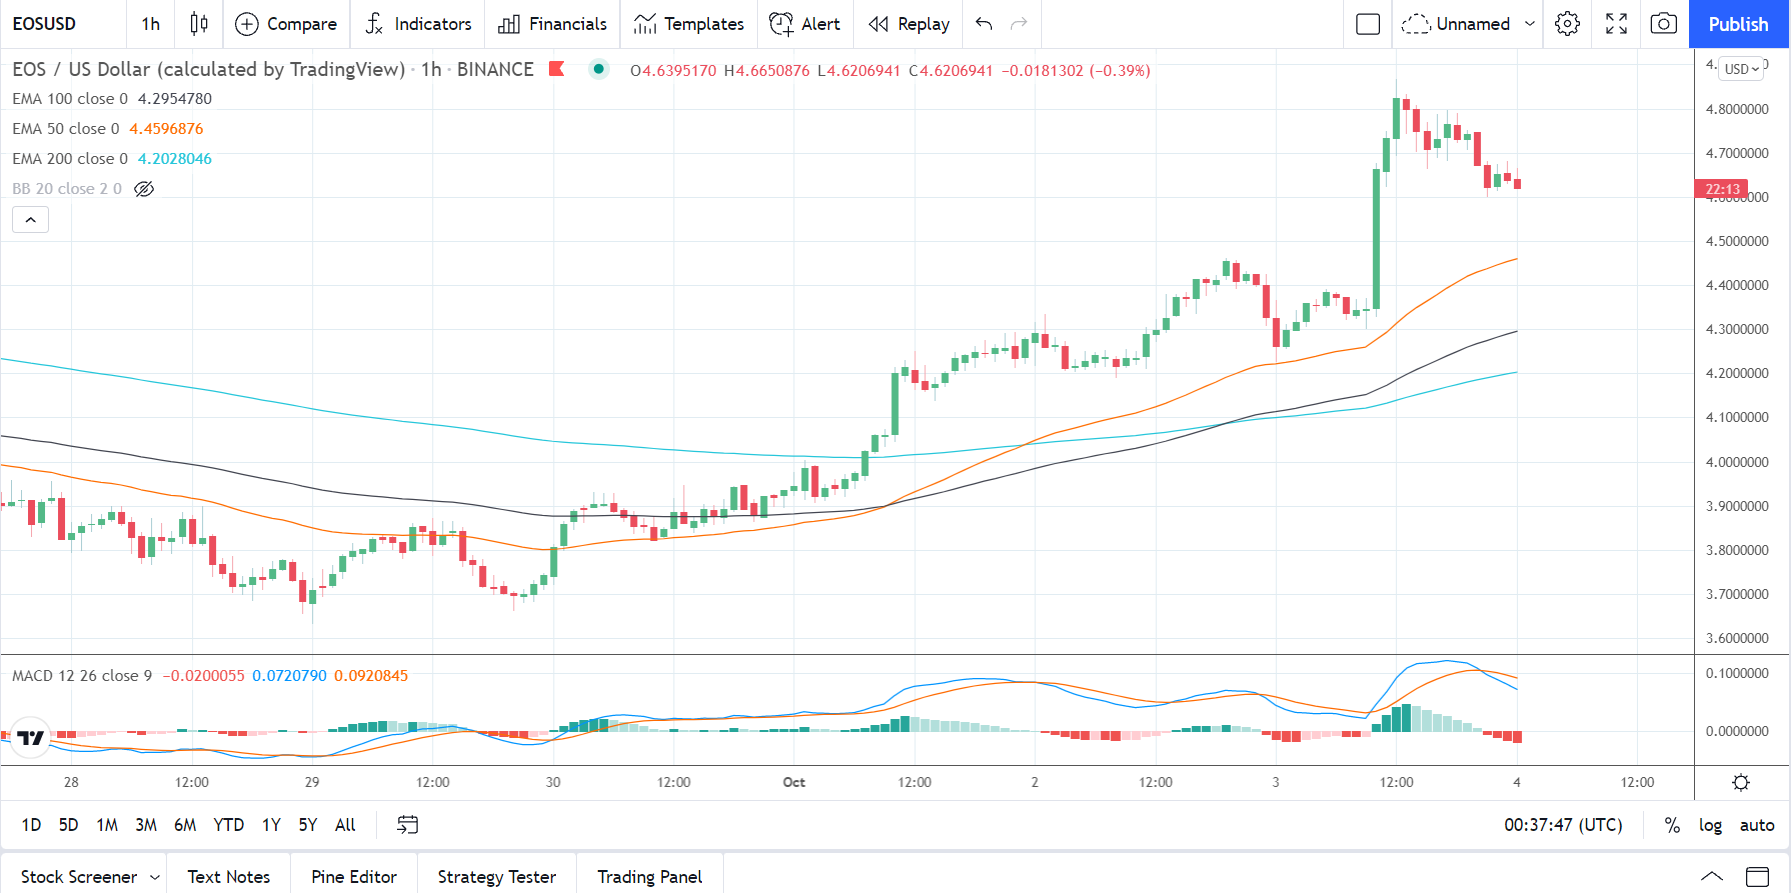
EOS rallied by 7.23% on Sunday. Following a 1.34% gain on Saturday, EOS ended the week up by 16.77% to $4.6388.
A bearish start to the day saw EOS fall to an early morning intraday low $4.2280 before making a move.
Steering clear of the first major support level at $4.1932, EOS rallied to a mid-day intraday high $4.8665.
EOS broke through the first major resistance level at $4.4627 and the second major resistance level at $4.5970.
Coming up against the third major resistance level at $4.8665, however, EOS slipped back to end the day at sub-$4.65 levels.
The second major resistance level at $4.5970 had delivered support late in the day.
At the time of writing, EOS was down by 0.39% to $4.6207. A mixed start to the day saw EOS rise to an early morning high $4.6651 before falling to a low $4.6207.
EOS left the major support and resistance levels untested early on.
For the day ahead
EOS would need to avoid the $4.5778 pivot to bring the first major resistance level at $4.9275 into play.
Support from the broader market would be needed to break out from Sunday’s high $4.8665.
Barring a broad-based crypto rally, the first major resistance and resistance at $5.00 would likely cap any upside.
In the event of an extended rally, EOS could test the second major resistance level at $5.2163 before any pullback.
A fall through the $4.5778 pivot would bring the first major support level at $4.2890 into play.
Barring an extended sell-off, however, EOS should steer clear of sub-$4.00 levels. The second major support level sits at $3.9393.
Looking at the Technical Indicators
First Major Support Level: $4.2890
First Major resistance Level: $4.9275
23.6% FIB Retracement Level: $6.52
38% FIB Retracement Level: $9.68
62% FIB Retracement Level: $14.77
Stellar’s Lumen
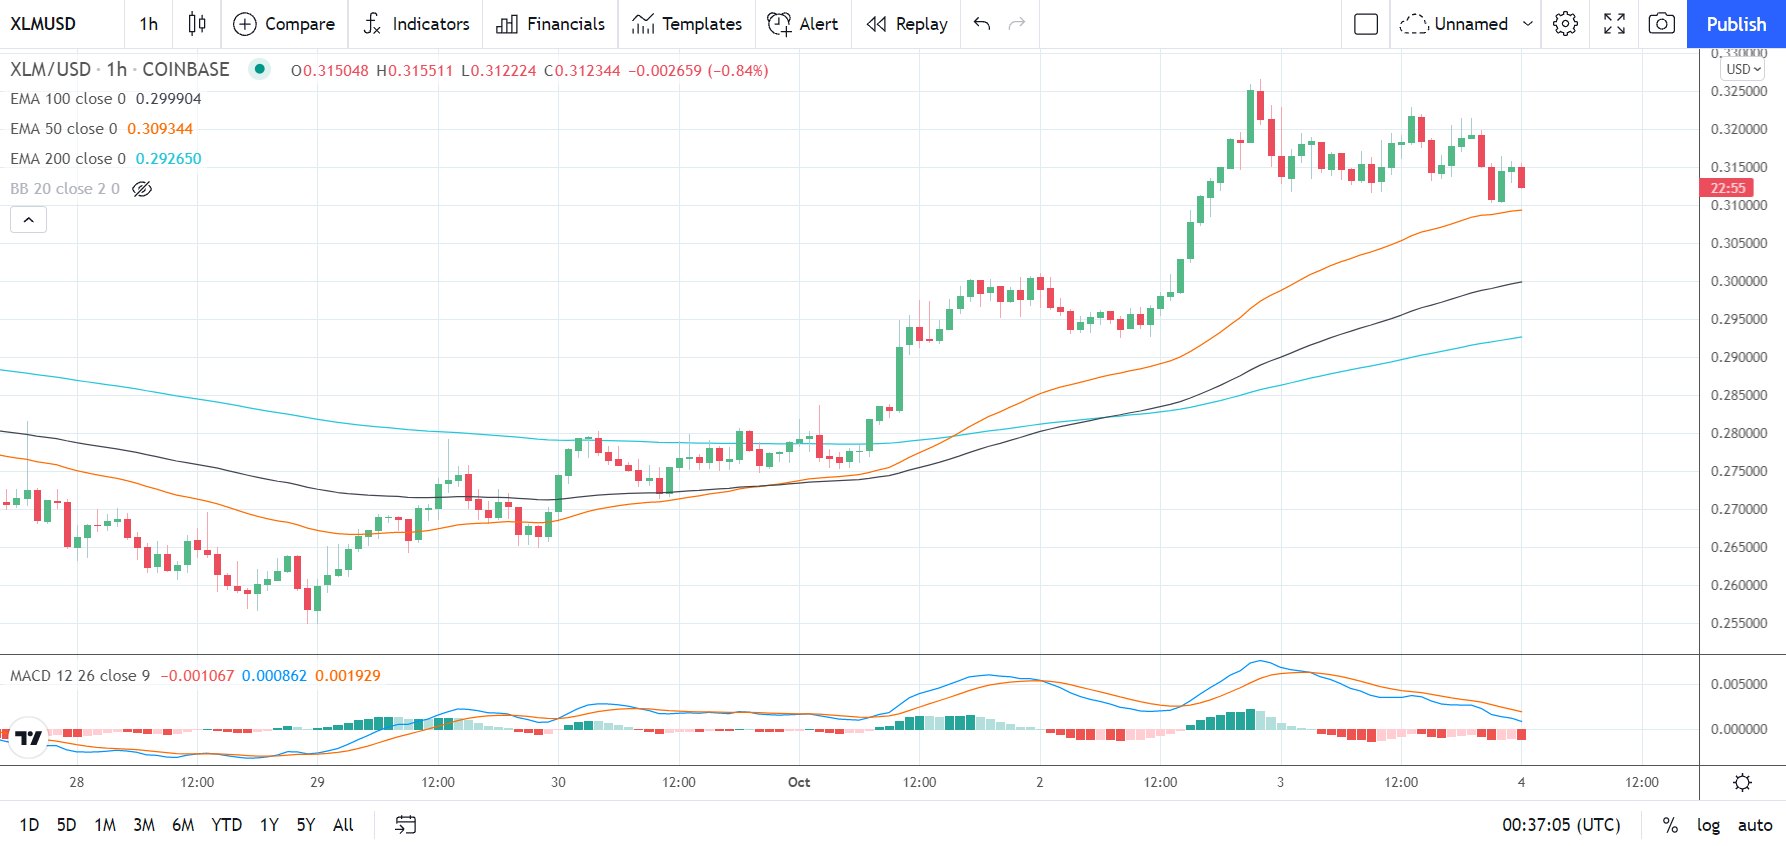
Stellar’s Lumen fell by 0.44% on Sunday. Partially reversing a resistance 5.32% gain from Saturday, Stellar’s Lumen ended the week up by 14.05% to $0.3150.
A mixed start to the day saw Stellar’s Lumen rise to an early morning intraday high $0.3230 before hitting reverse.
Falling short of the first major resistance level at $0.3313, Stellar’s Lumen fell to a late morning intraday low $0.3117.
Steering clear of the first major support level at $0.2973, Stellar’s Lumen briefly revisited $0.32 levels before falling back into the red.
At the time of writing, Stellar’s Lumen was down by 0.84% to $0.3123. A mixed start to the day saw Stellar’s Lumen rise to an early morning high $0.3155 before falling to a low $0.3122.
Stellar’s Lumen left the major support and resistance levels untested early on.
For the day ahead
Stellar’s Lumen would need to move through the $0.3166 pivot to bring the first major resistance level at $0.3214 into play.
Support from the broader market would be needed, however, for Stellar’s Lumen to break back through to $0.32 levels.
Barring an extended rally, the first major resistance level and Sunday’s high $0.3230 would likely cap the upside.
In the event of a broad-based crypto rally, Stellar’s Lumen could test resistance at $0.33 levels before any pullback. The second major resistance level sits at $0.3279.
Failure to move through the $0.3166 pivot would bring the first major support level at $0.3101 into play.
Barring another extended sell-off on the day, Stellar’s Lumen should steer clear of sub-$0.30 levels. The second major support level at $0.3053 should limit the downside.
Looking at the Technical Indicators
First Major Support Level: $0.3101
First Major Resistance Level: $0.3214
23.6% FIB Retracement Level: $0.3402
38% FIB Retracement Level: $0.4277
62% FIB Retracement Level: $0.5690
Tron’s TRX
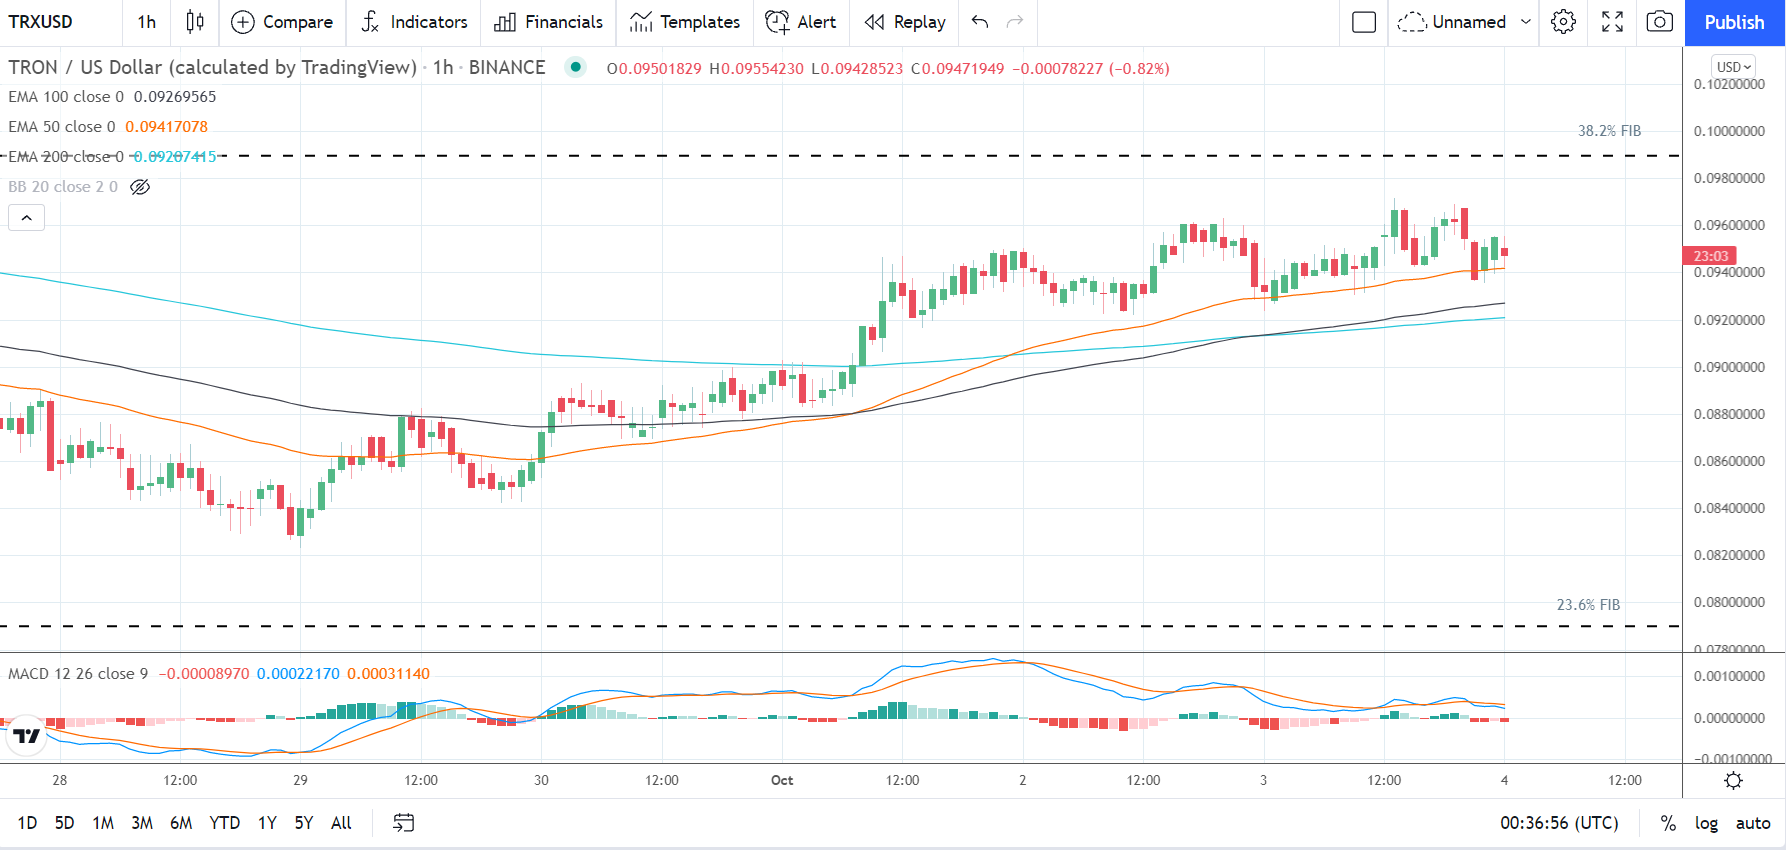
Tron’s TRX rose by 2.20% on Sunday. Reversing a 1.49% fall from Saturday, Tron’s TRX ended the week up by 8.39% to $0.09550.
A bearish start to the day saw Tron’s TRX fall to an early morning intraday low $0.09249 before making a move.
Steering clear of the first major support level at $0.09168, Tron’s TRX rallied to an early afternoon intraday high $0.09716.
Tron’s TRX broke through the first major resistance level at $0.09575 before briefly falling back to sub-$0.094 levels.
Finding late support, however, Tron’s TRX ended the day at $0.0955 levels. The first major resistance level at $0.09575 pinned Tron’s TRX back late in the day.
At the time of writing, Tron’s TRX was down by 0.82% to $0.09472. A mixed start to the day saw Tron’s TRX rise to an early morning high $0.09554 before falling to a low $0.09429
Tron’s TRX left the major support and resistance levels untested early on.
For the Day Ahead
Tron’s TRX would need to move back through the $0.09505 pivot to bring the first major resistance level at $0.09761 into play.
Support from the broader market would be needed, however, for Tron’s TRX to break through Sunday’s high $0.09716.
Barring an extended crypto rally, the first major resistance level would likely cap the upside.
In the event of a broad-based crypto rally, Tron’s TRX could test the second major resistance level at $0.09972 before any pullback. Tron’s TRX would need plenty of support, however, to breakout from the 38.2% FIB of $0.09890.
Failure to move back through the $0.09505 pivot would bring the first major support level at $0.09294 into play.
Barring an extended sell-off, however, Tron’s TRX should steer clear of sub-$0.090 levels. The second major support level at $0.09038 should limit the downside.
Looking at the Technical Indicators
First Major Support Level: $0.09294
First Major Resistance Level: $0.09761
23.6% FIB Retracement Level: $0.0787
38.2% FIB Retracement Level: $0.0989
62% FIB Retracement Level: $0.1316
Please let us know what you think in the comments below
Thanks, Bob
About the Author
Bob Masonauthor
With over 20 years of experience in the finance industry, Bob has been managing regional teams across Europe and Asia and focusing on analytics across both corporate and financial institutions. Currently he is covering developments relating to the financial markets, including currencies, commodities, alternative asset classes, and global equities.
Did you find this article useful?
Latest news and analysis


Advertisement