
Advertisement
Advertisement
S&P500 and German DAX Elliott Wave Cycles Approaching Support
By:
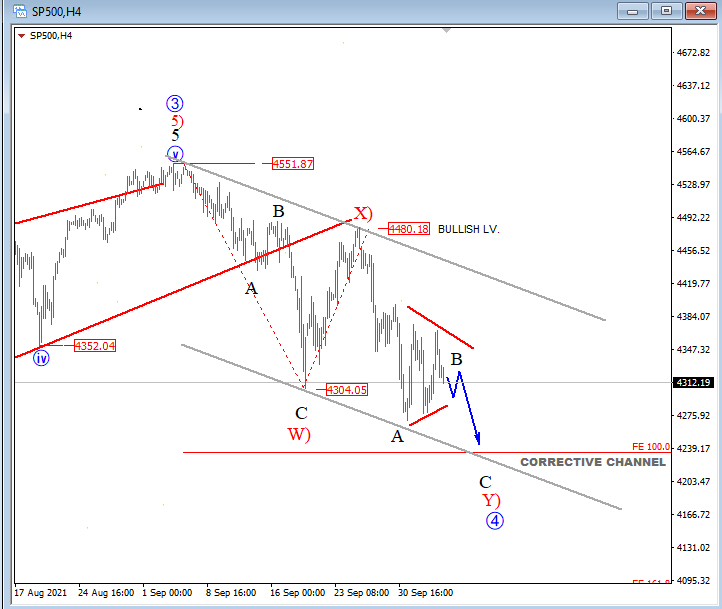
The S&P500 is trapped in a 4270-4370 range that we see it as a corrective movement, can cause a final sell-off down to around 4180/4220 support.

In this article:
S&P500 is coming down after corrective rise was finished at 4480 last week which we now labeled as wave X on 4h chart. The reason is the current price action above 4260 that looks like a correction, possibly triangle in B so another and final leg down can occur to around 4200-4230 support zone.
S&P500 4h Elliott Wave Analysis
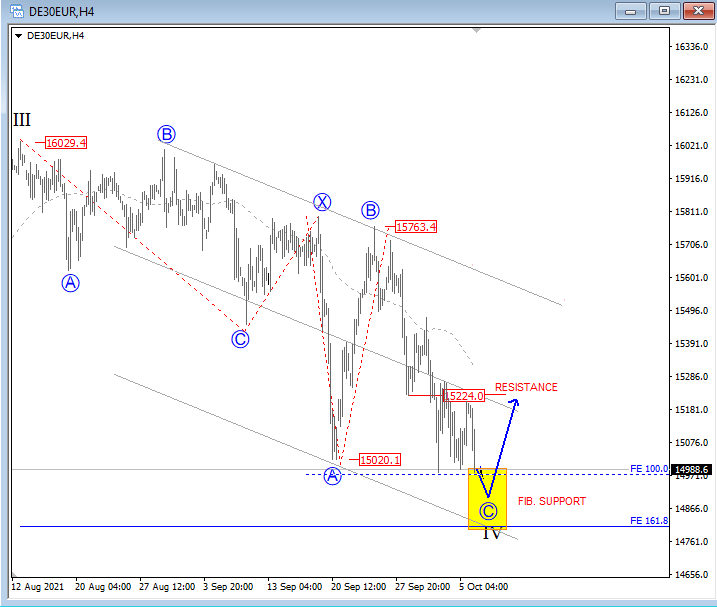
DAX is coming down in the past few days, so weakness can be limited, possibly at around 14800 area. From an EW perspective we are aware of a turn, but any potential low on DAX remains unconfirmed until we see a bullish reversal with five waves.
On 4h chart DAX is coming sharply down again and seems like it’s making a deeper and complex 7-swing correction with final wave C already at the low, so bears may slow down at Fib support, here at 13800-14950 area. But like always, we need an impulse from the low to confirm a bullish turn
DAX 4h Elliott Wave Analysis
About the Author
Gregor Horvatcontributor
Gregor is based in Slovenia and has been involved in markets since 2003. He is the owner of Ew-Forecast, but before that, he was working for Capital Forex Group and TheLFB.com.
Did you find this article useful?
Latest news and analysis


Advertisement