
Earnings Season Set To Begin This Week
The 3Q earnings season begins in earnest this week. Leading up to this, the revision trend is up and stocks have come under a little pressure. Post-earnings reaction likely gets influenced by several variables, not the least of which is extended multiples.

The 3Q earnings season begins in earnest this week. Customarily, financials will get the ball rolling. JP Morgan (JPM) reports on Wednesday, Citigroup (C), Bank Of America (BAC), Morgan Stanley (MS) and Wells Fargo (WFC) on Thursday, and Goldman Sachs (GS) on Friday.
Ahead of this, as of last Wednesday, operating earnings estimates for S&P 500 (SPX) companies fell $0.06 week-over-week to $48.20. In the same quarter last year, they pulled in $37.90.
In January last year, the sell-side expected $50.35 for 3Q21. Then, COVID-19 hit, and these analysts brought out their scissors. Estimates bottomed in July last year at $41.69. The upward revision trend that followed persisted until September 8 when $48.59 was hit (Chart 1).
Stocks are under pressure leading up to it.
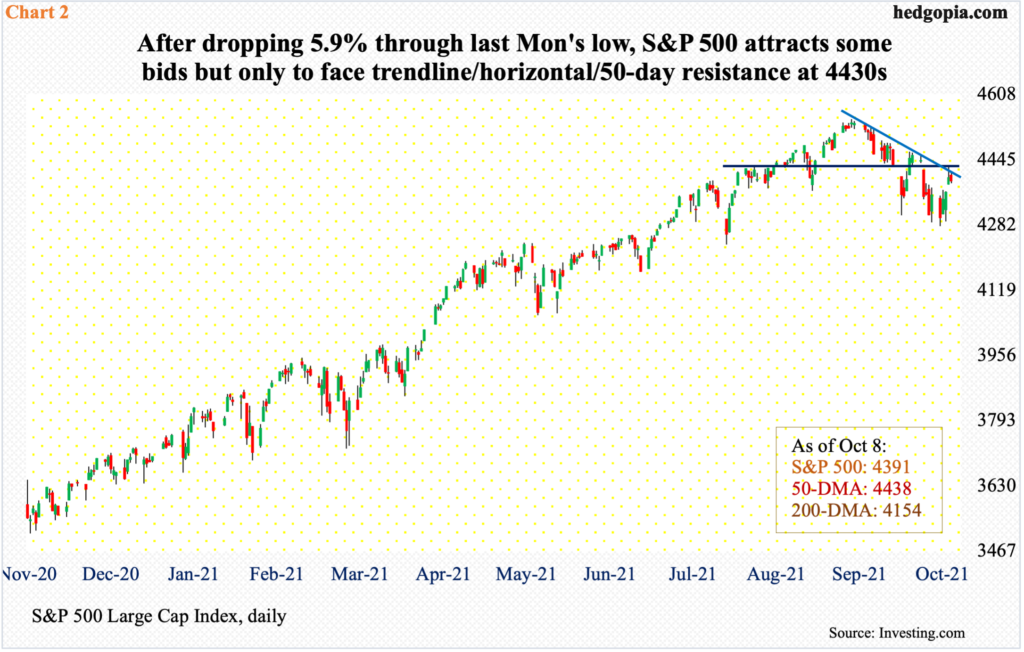
From its September 2 high of 4546 through last Monday’s low of 4279, the S&P 500 lost 5.9 percent. Bulls tried to put their foot down in the remaining sessions last week but were unable to hang on to all of Thursday’s gains, with the shooting star session just about testing the 50-day and reversing. The average also lines up with short-term horizontal resistance at 4430s (Chart 2). Plus, this is where a falling trend line from September 2 extends to.
On the daily, there is room to rally. If the 50-day falls, there is horizontal resistance at 4480s. At the same time, having succeeded in repelling a rally attempt last Thursday, bears will be looking for opportunities. Importantly, daily indicators such as the RSI seem to want to go lower from the median.
A lot will depend on how the companies mentioned above deliver this week and how their reports are perceived. XLF (Financial Select Sector SPDR Fund) rose to a new high last Thursday. It could very well be a ‘buy the rumor, sell the news’ phenomenon.
No matter how the S&P 500, and stocks in general, behave in the sessions and weeks ahead, valuations are not on the side of the bulls.
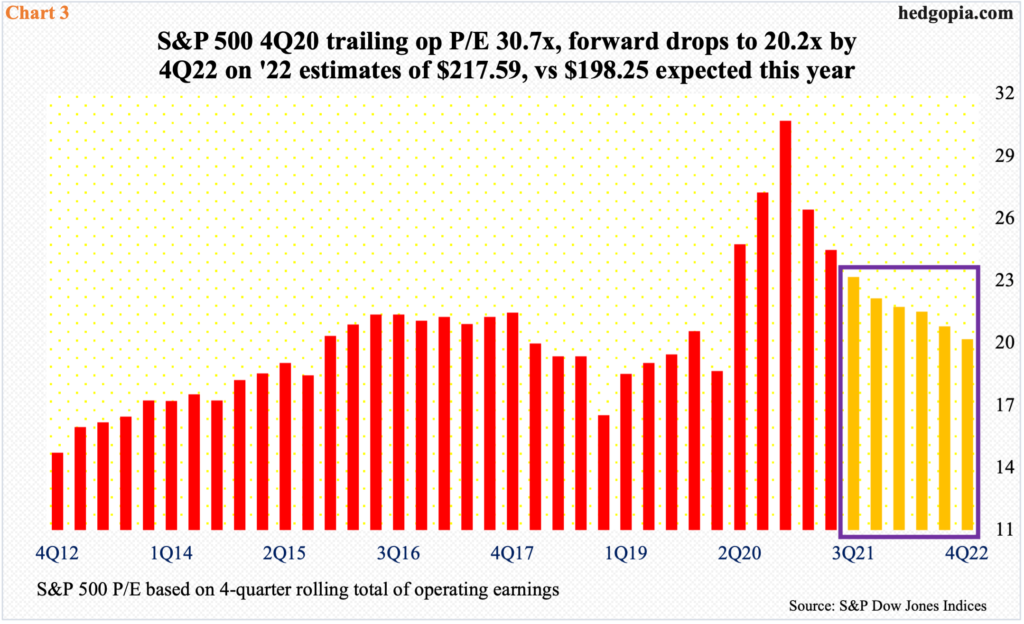
Using trailing 12-month operating earnings, the S&P 500 sported a P/E ratio of 30.7x in 4Q20. In 2020, these companies earned $122.37, down from $157.12 in 2019. Earnings have recovered massively this year, with the first half ringing up $99.46 and $98.80 expected in the second half for a total $198.25. The rise in earnings has accompanied a massive rally in the index. Nevertheless, the PE multiple has improved, with 2Q at 24.5x on a trailing basis (Chart 3). This progressively improves in the quarters ahead. If next year’s expected $217.59 comes through, at the current price, P/E will have improved to 20.2x, which is still elevated.
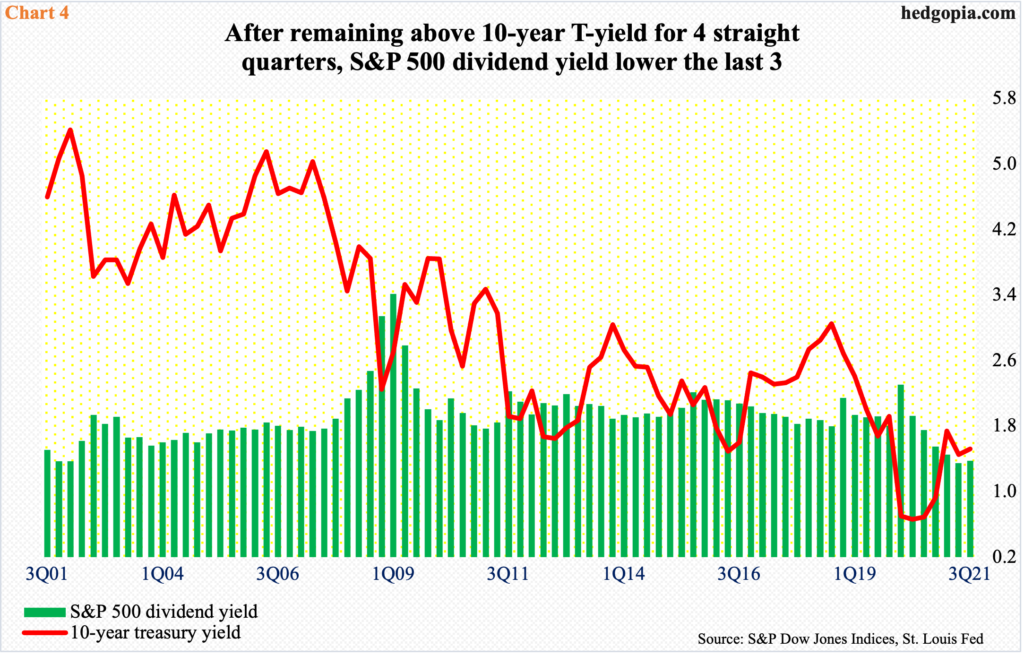
As the S&P 500 has continued to push higher, the dividend yield has come under pressure. It is not that companies are being frugal in dividend payouts. They have been very generous. As a matter of fact, the 3Q distribution of $15.36 is a new quarterly record, surpassing the pre-pandemic high of $15.32 from 1Q20. The four-quarter total of $59.26 in 3Q21 is not that far away from the all-time high of $59.68 from 2Q20.
Nevertheless, the dividend yield hit 1.35 percent in 2Q21 – the lowest since 1.28 percent in 2Q01 – before rising a tad to 1.38 percent in the last quarter. This is lower than the 10-year treasury yield (SPTL). To be fair, for two decades now, the dividend yield for the most part has remained under the 10-year yield. Most recently, after remaining above for four quarters, the dividend yield went back below the 10-year yield in the last three (Chart 4).
Viewed this way, bonds compete very well with equities.
Amidst this, it is possible S&P 500 operating earnings will reach an important juncture in the current quarter.
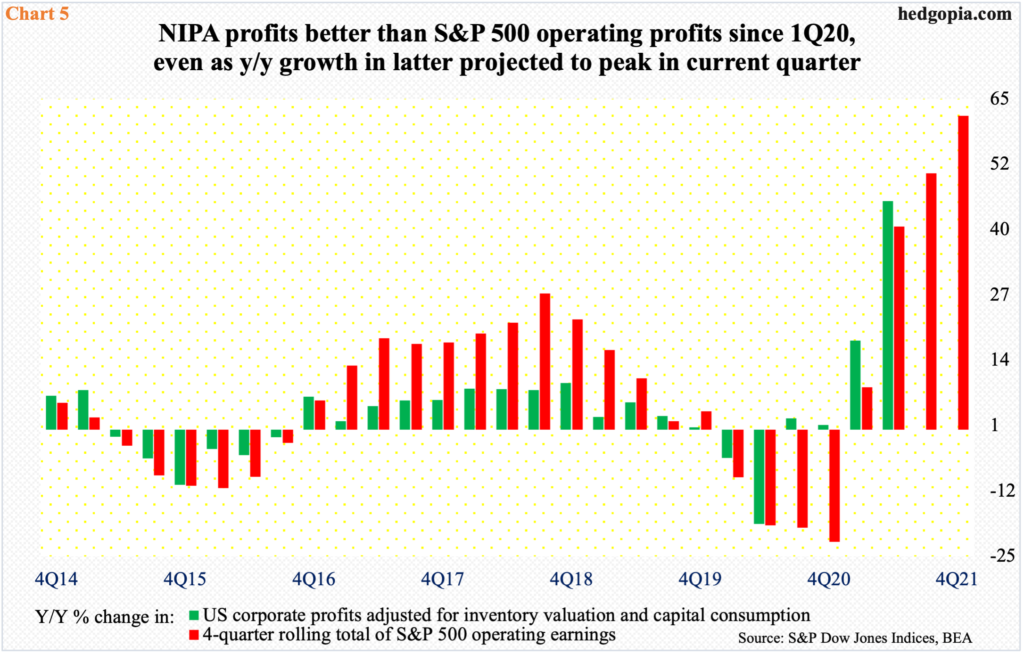
Chart 5 tallies the year-over-year percent change in the four-quarter total of S&P 500 operating earnings and US corporate profits adjusted for inventory valuation and capital consumption. Directionally, the two tend to move together.
In good times, the red bars in the chart tend to perform better than the green ones. But since 1Q20, corporate profits have outperformed – by either dropping less than S&P 500 operating earnings or rising more. Increasingly, it is beginning to look like S&P 500 companies are struggling to squeeze more juice out of non-GAAP earnings.
In 2Q21, the four-quarter total of S&P 500 operating earnings grew 40.1 percent y/y. If 3Q comes in as expected, earnings would have grown by 50.6 percent and then by 62 percent in the current quarter before peaking. Next year, the growth rate is set to rapidly decelerate, to 9.8 percent by 4Q. If past is prelude, the S&P 500 should follow it lower.
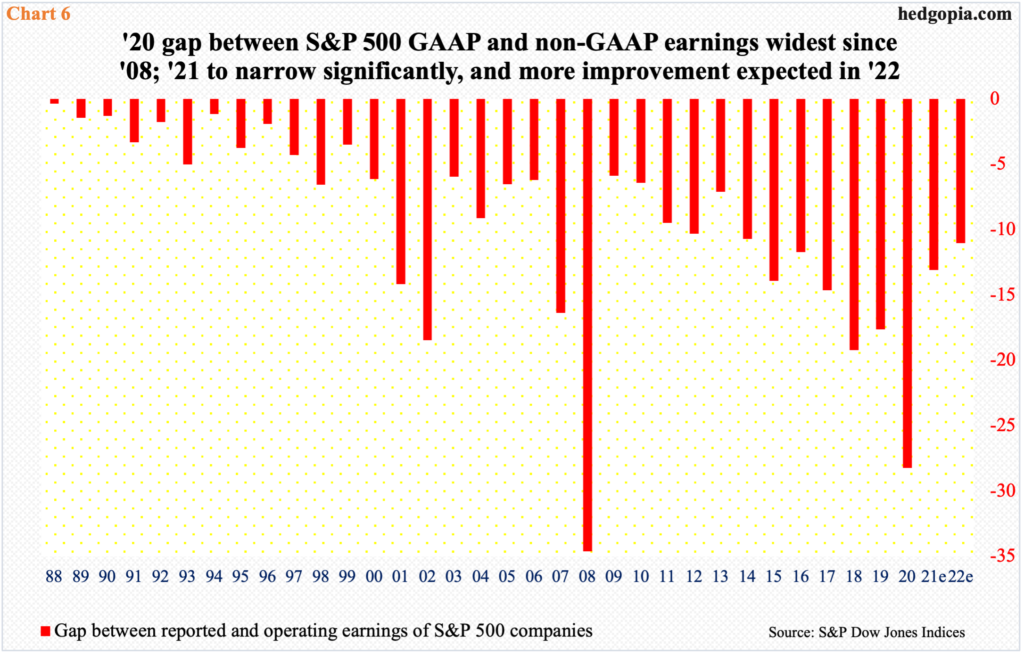
Speaking of GAAP versus non-GAAP, the gap between the two hit minus $28.24 in 2020, with reported earnings of $94.13 and operating earnings of $122.37. This was the widest gap since 2008 (Chart 6).
Ordinarily, the lower the gap, the better the quality of earnings. So, just based on this, the quality of earnings is set to improve this year and is expected to improve further next year. As previously alluded, this also suggests these companies are running out of room to massage non-GAAP earnings. Hence the importance of multiples.
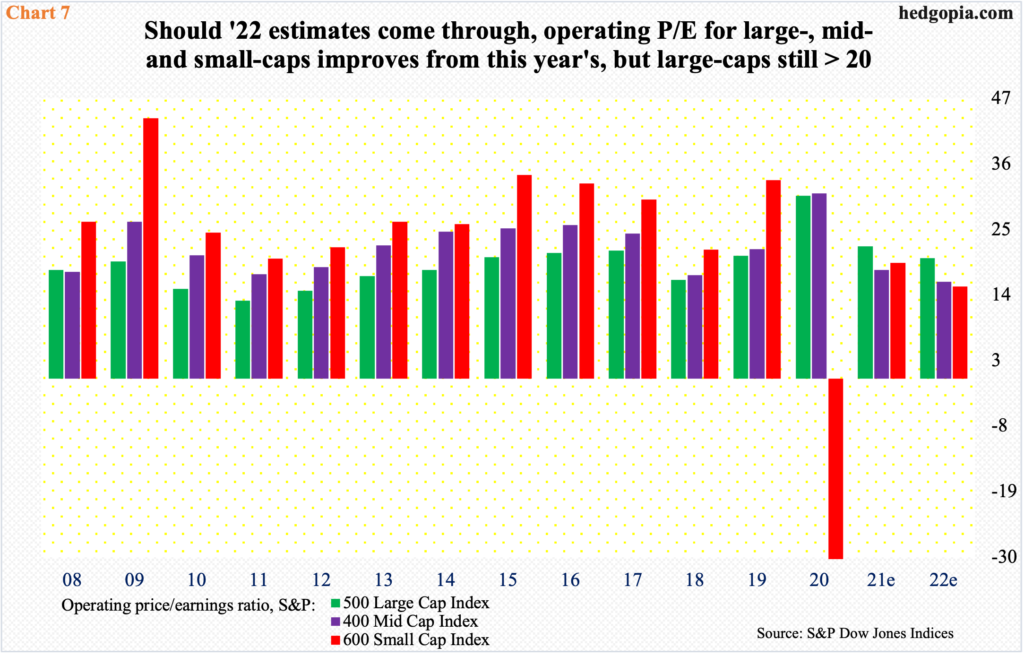
Chart 7 calculates the operating P/E for all three buckets under the S&P umbrella – large cap, mid cap, and small cap. Relative to this year, the ratio is expected to improve next year in all three, assuming, of course, the constituent companies hit their numbers.
Interestingly, next year’s estimates for S&P 500 companies peaked mid-September at $218.04, even as estimates for 400 and 600 companies continued to post new highs last week, respectively $165.43 and $87.83. Accordingly, on next year’s earnings, both the 400 and 600 command a P/E ratio of 15-16x, which looks reasonable. But the big honcho, the S&P 500, is north of 20x. By and large, at least directionally, as goes the S&P 500 so goes the market. As things stand, multiples have increasingly ceased to act as a tailwind for S&P 500 bulls.
Thanks for reading!
Disclaimer: This article is not intended to be, nor shall it be construed as investment advice. Neither the information nor any opinion expressed here constitutes an offer to buy or sell any ...
more

