
Advertisement
Advertisement
NZD/USD Forex Technical Analysis – Below Average Volume Holding Kiwi Inside .6877 and .6982
By:
The direction of the NZD/USD on Tuesday is likely to be determined by trader reaction to the Fibonacci level at .6924.

In this article:
The New Zealand Dollar is trading flat-to-lower in a limited trade early Tuesday with prices trapped inside October 6th’s wide range. The Kiwi seems to be underpinned by last week’s rate hike by the Reserve Bank (RBNZ) but capped by investors betting on a November tapering by the U.S. Federal Reserve.
The only thing we can be certain of is impending volatility. The direction is up in the air. One would think the bias would be to the upside with the RBNZ expected to make several rate hikes before the Fed makes its first in late 2022, but that hasn’t been the case.
At 03:20 GMT, the NZD/USD is trading .6930, down 0.0007 or -0.10%.
Daily Swing Chart Technical Analysis
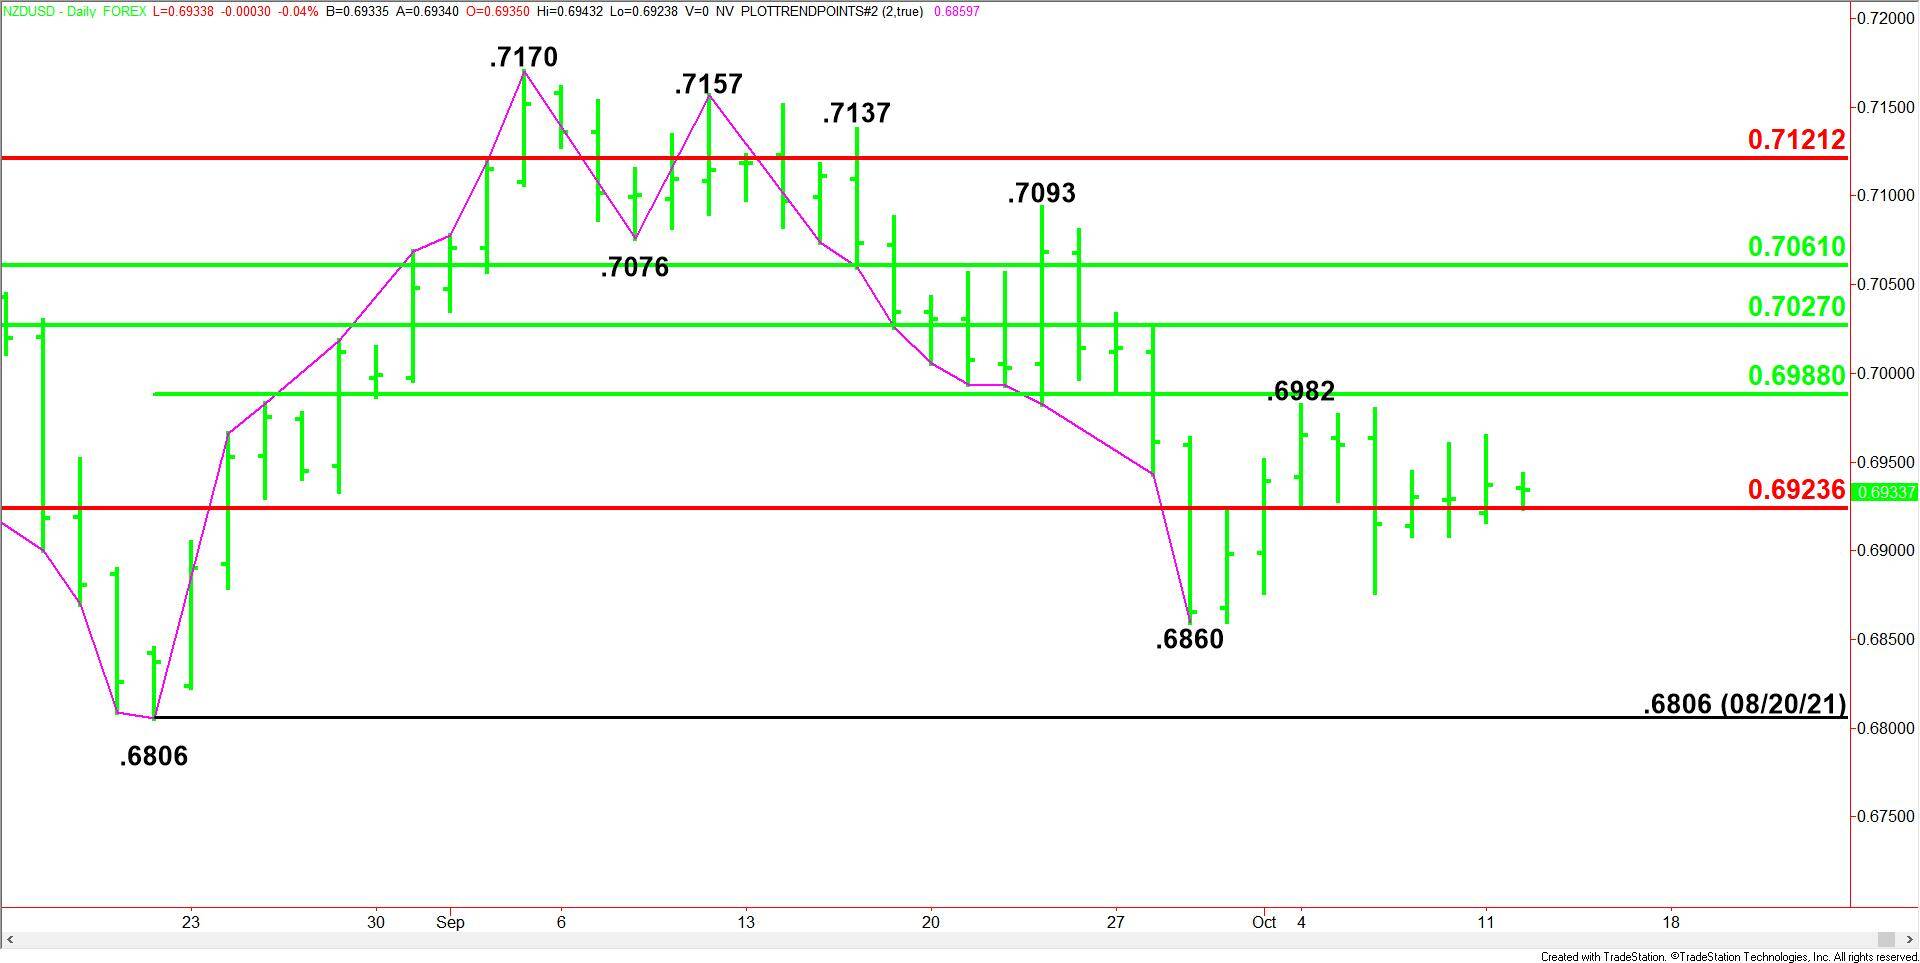
The main trend is down according to the daily swing chart. A trade through the nearest main bottom at .6806 will reaffirm the downtrend. A move through .7157 will change the main trend to up.
The minor trend is also down. A trade through .6982 will change the minor trend to up. This will also shift momentum to the upside. A move through .6860 will increase the downside momentum.
The NZD/USD is currently straddling a Fibonacci level at .6924, making it support.
On the upside, the nearest resistance is a 50% level at .6988, followed by a second 50% level at .7027.
Daily Swing Chart Technical Forecast
The direction of the NZD/USD on Tuesday is likely to be determined by trader reaction to the Fibonacci level at .6924.
Bullish Scenario
A sustained move over .6924 will indicate the presence of buyers. The first upside target is .6930. Overcoming this level could create the upside momentum needed to eventually challenge the minor top at .6982 and the 50% level at .6988. In order to get there on Tuesday, the volume has to come in above average.
Bearish Scenario
A sustained move under .6924 will indicate the presence of sellers. The first downside target is .6921, followed by .6877.
If .6877 fails to hold then look for the selling to possibly extend into .6860. This is the last potential support before the .6806 main bottom.
For a look at all of today’s economic events, check out our economic calendar.
About the Author
James Hyerczykauthor
James is a Florida-based technical analyst, market researcher, educator and trader with 35+ years of experience. He is an expert in the area of patterns, price and time analysis as it applies to futures, Forex, and stocks.
Did you find this article useful?
Latest news and analysis


Advertisement