
US Dollar Bounce From Strong Support
The market is not surprised by the US dollar index bounce from the long term support juncture. Since the support juncture was presented a few months ago. The US dollar has been the strongest currency on the board in recent days and is expected to remain for some time. On the other hand, the long-term trend remains downward, and any indication of a reversal could be interpreted as a selling opportunity in US dollars.
Highlights
- The US dollar has been supported on the long term support juncture and prices are heading higher.
- JPY has been the weakest currency with USDJPY as breaking to the next levels. The instrument may encounter resistance when USD is ready to decline for the next round.
Weakest Currency: JPY
Strongest Currency: CAD
Best Instruments to Focus:
Short NZDCAD
Long USDJPY
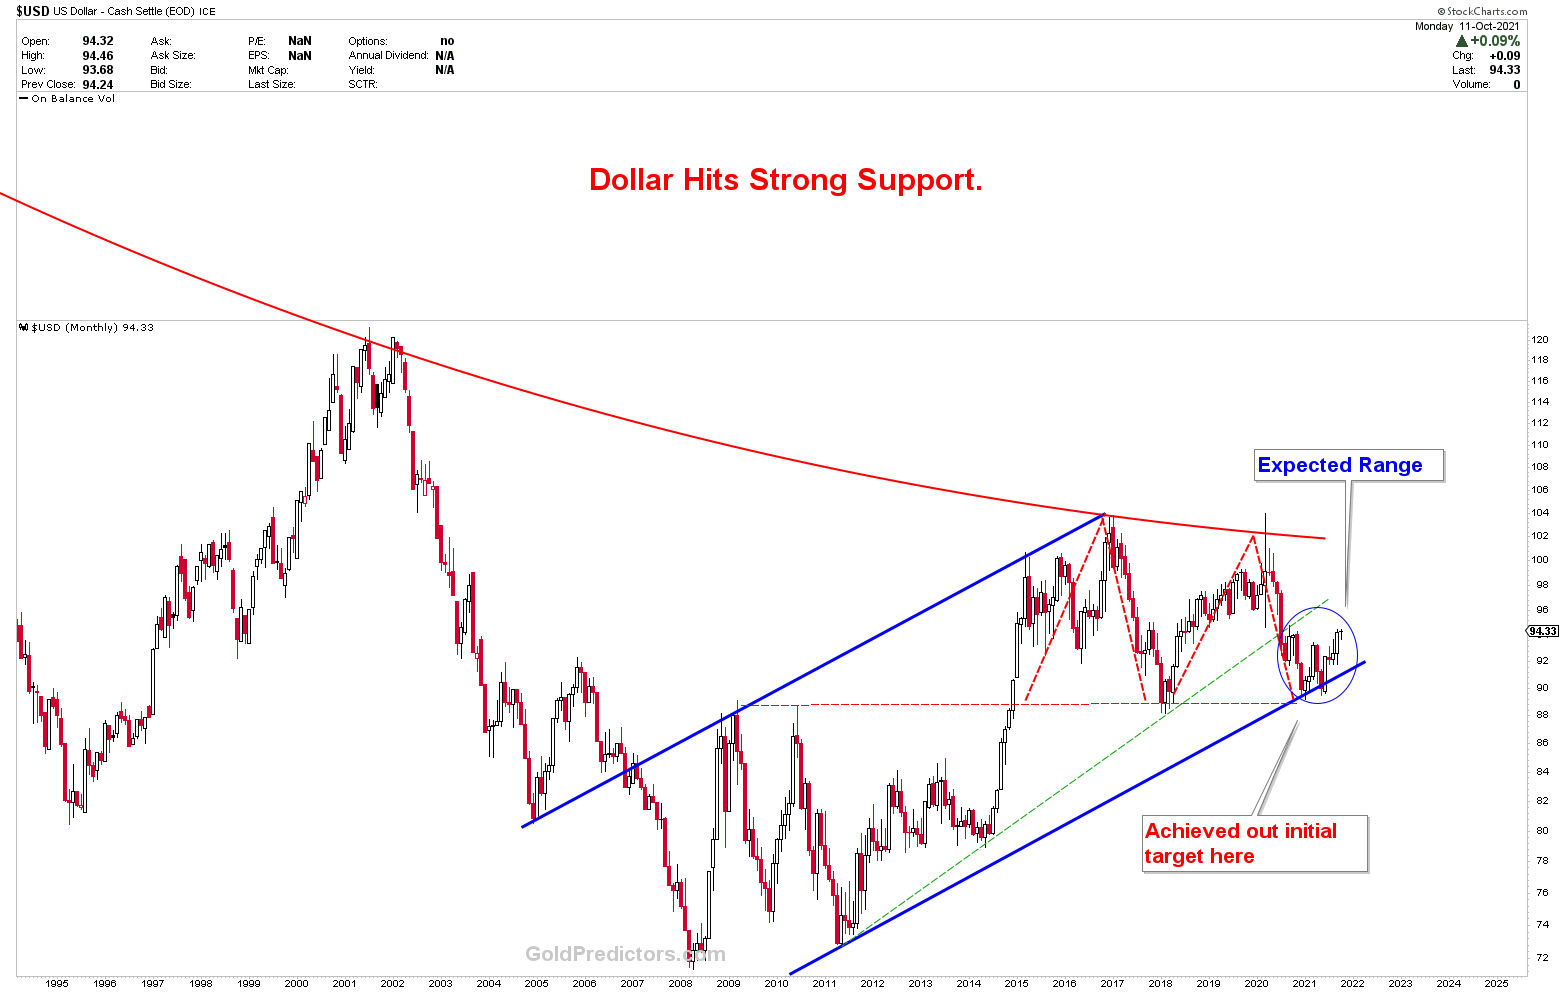
The chart below was presented months ago when stated that the support juncture in the US dollar is massive and that any bounce from here could develop. The rising blue channel and the red horizontal support line provided support for the support juncture. Any rebound from this point, however, was expected to be viewed as a selling opportunity in US dollars. Since the US dollar is advancing as one of the strongest currencies on the board, it is best to stick with the higher index until there is any indication of a reversal. In the short term, the US dollar is expected to rise to large ranges.
(Click on image to enlarge)
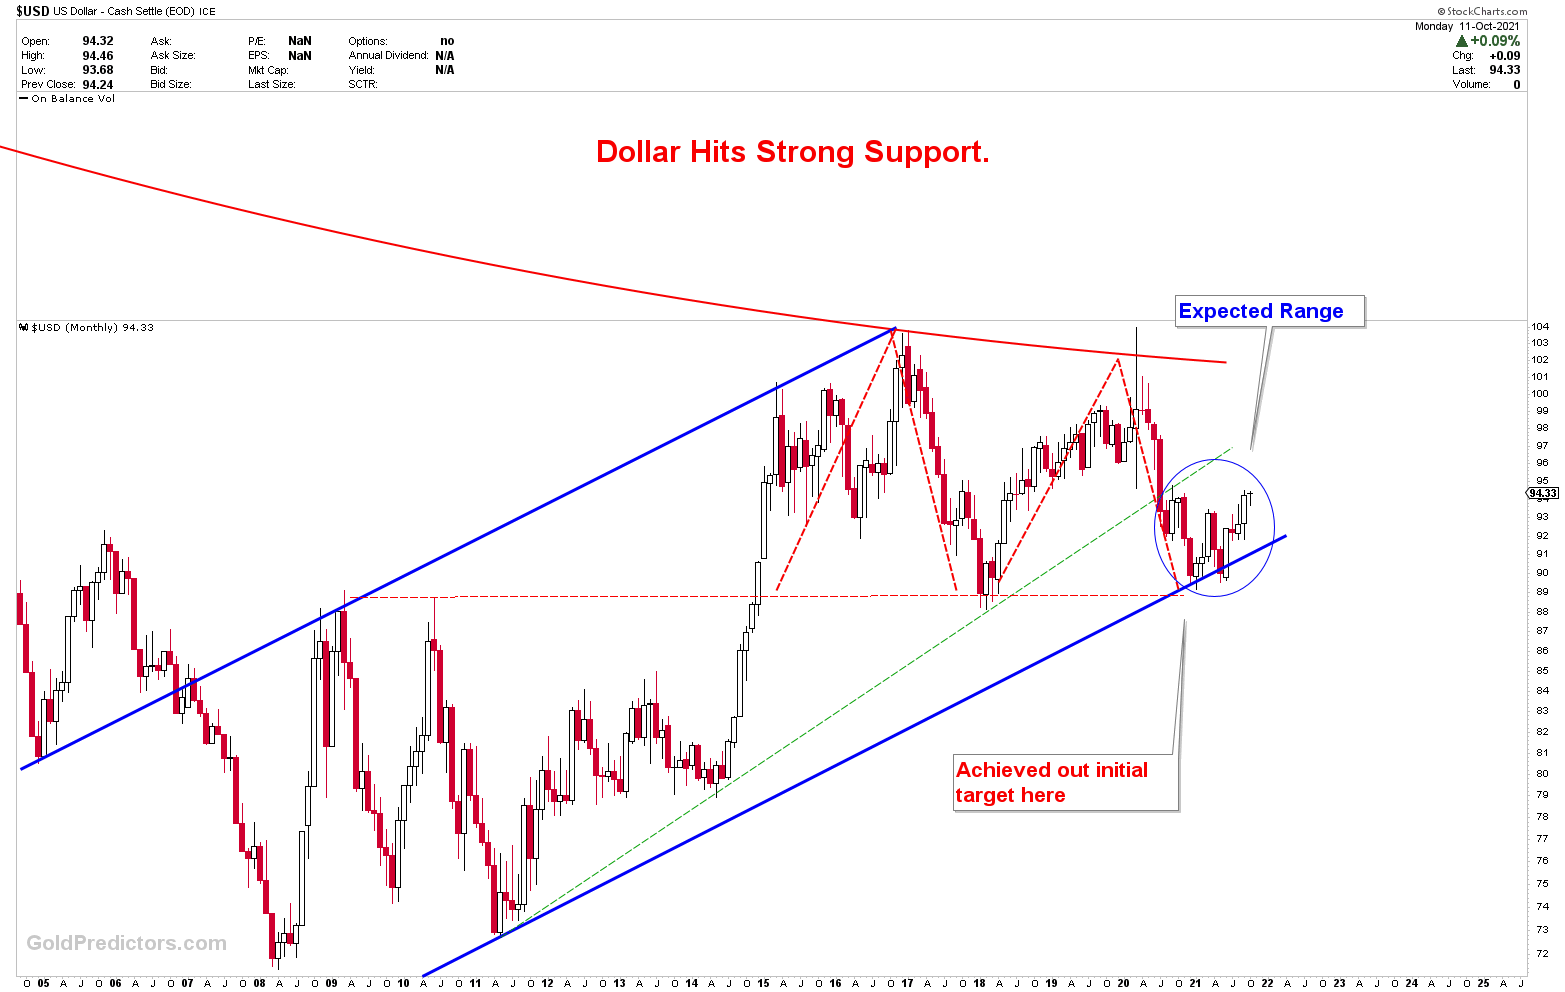
On a zoomed-out view of the chart, the expected wide ranges are marked by a blue circle. The bottom in the US dollar index is marked by a strong support juncture, and prices are rising in the short term.
(Click on image to enlarge)
Short-Term USD Index
The weekly outlook is depicted in the chart below, where the double bottom is highlighted and prices are expected to rise. In the short term, we expect the US dollar to trade in wide ranges with a bullish bias. However, the next decline in the US dollar could occur at any time.
(Click on image to enlarge)
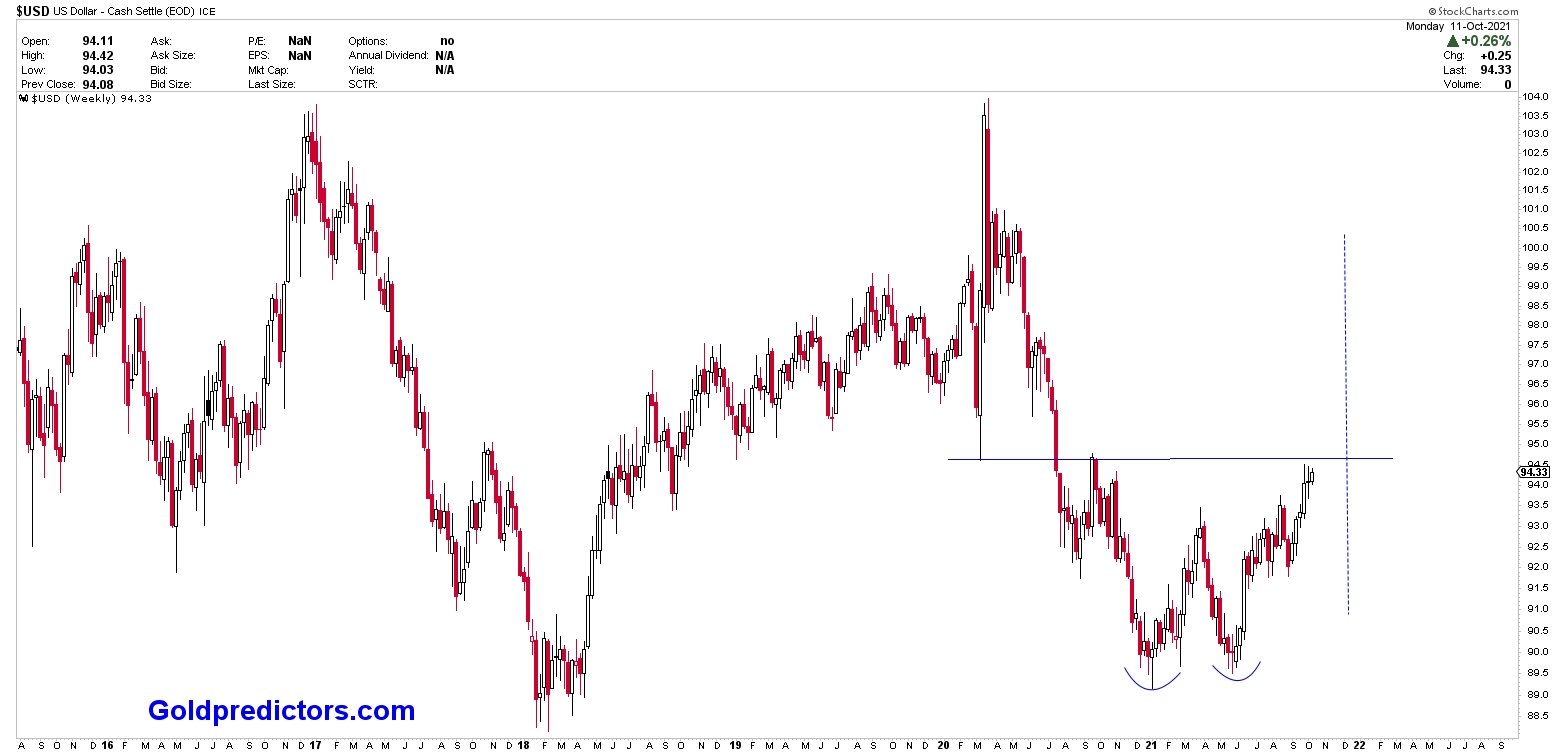
Path of least resistance in US dollar remains higher. However Trading range environment is likely to remain valid. Long-term trends remains lower. Until there is any reversal in the index, the risk remains high.
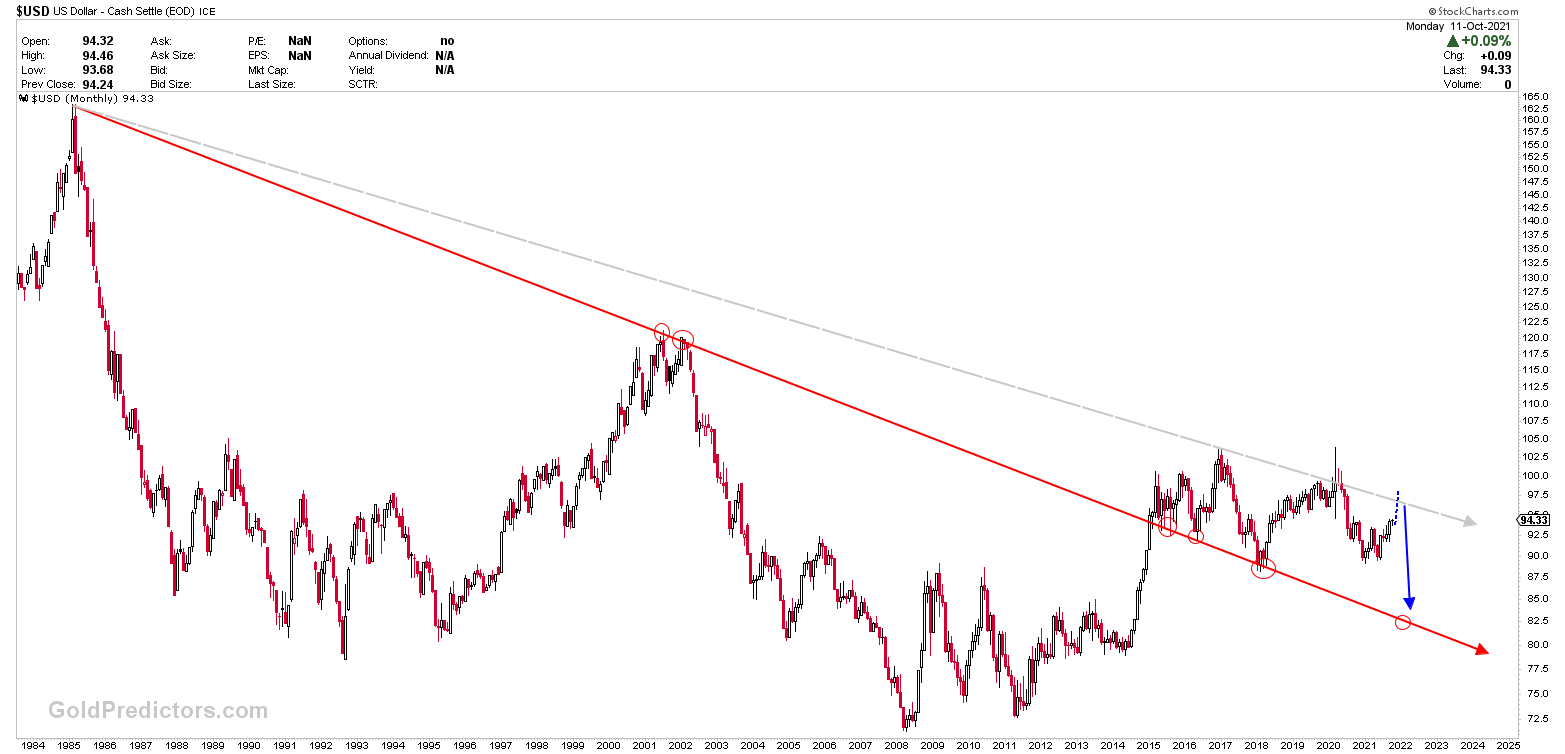
The chart below depicts the monthly view of the US dollar index by drawing a trend line from 1985. The long-term line is not expected to play out exactly as planned. According to the explanation in US dollars, we anticipated a strong bounce from long term support juncture, which has already took place. Once this rally is over, the US dollar index is expected to fall abruptly. This sharp decline in the US dollar must be viewed as one of the parameters that will propel gold to $2,300 levels. Based on the US dollar behavior, markets must follow their respective path.
(Click on image to enlarge)
Because of the weakness of the JPY and the strength of the USD, the best instrument to focus on in the short term is USDJPY. Since the USD and EUR are inversely proportional, the EURUSD must fall in conjunction with the USD rally. GBPNZD has been very volatile with no clear direction, whereby NZDCAD has been declining towards the targets.
Disclaimer: Articles/Short-term & Long-term Trading signals/Newsletters distributed by GoldPredictors.com has no regard to the specific investment objectives, financial situation or the ...
more

