
British Pound Technical Analysis: GBP/AUD, GBP/CAD, GBP/NZD Rates

COMMODITY CURRENCIES FLEX ON STERLING
The British Pound is proving weaker against the major commodity currencies, the Australian, Canadian, and New Zealand Dollars. But this may not be so much a Sterling story as it is a commodity store: surging input prices are prolonging elevated inflation pressures. It is well understood that exchange rate movements can be driven by commodity price changes and that this linkage isn’t tethered by general risk appetite.
So, even if rising Bank of England rate hike odds are helping the British Pound fare well compared to the Euro, Japanese Yen, and US Dollar, the ongoing rise in energy and industrial base metals can prove to be a considerable burden for pairs like GBP/AUD, GBP/CAD, and GBP/NZD. And it certainly doesn’t help that the Bank of Canada, Reserve Bank of Australia, and Reserve Bank of New Zealand are seeing hawkish expectations arrive at the same time.
GBP/AUD RATE TECHNICAL ANALYSIS: DAILY CHART (FEBRUARY 2020 TO OCTOBER 2021) (CHART 1)
(Click on image to enlarge)

GBP/AUD rates are dropping towards the ascending trendline from the January and May swing lows, imperiling what has been a steady appreciation over the past 10 months. Momentum continues to deteriorate, with the GBP/AUD rats below their daily 5-, 8-, 13-, and 21-EMA envelope, which is in bearish sequential order. Daily MACD is dropping while below its signal line, and daily Slow Stochastics are persisting in oversold territory.
A deeper setback towards the 23.6% Fibonacci retracement of the 2020 high/2021 low range at 1.8227 may be in process (which would likewise constitute a return to the descending trendline from the October 2008 and August 2015 highs).
GBP/CAD RATE TECHNICAL ANALYSIS: DAILY CHART (MARCH 2020 TO OCTOBER 2021) (CHART 2)
(Click on image to enlarge)
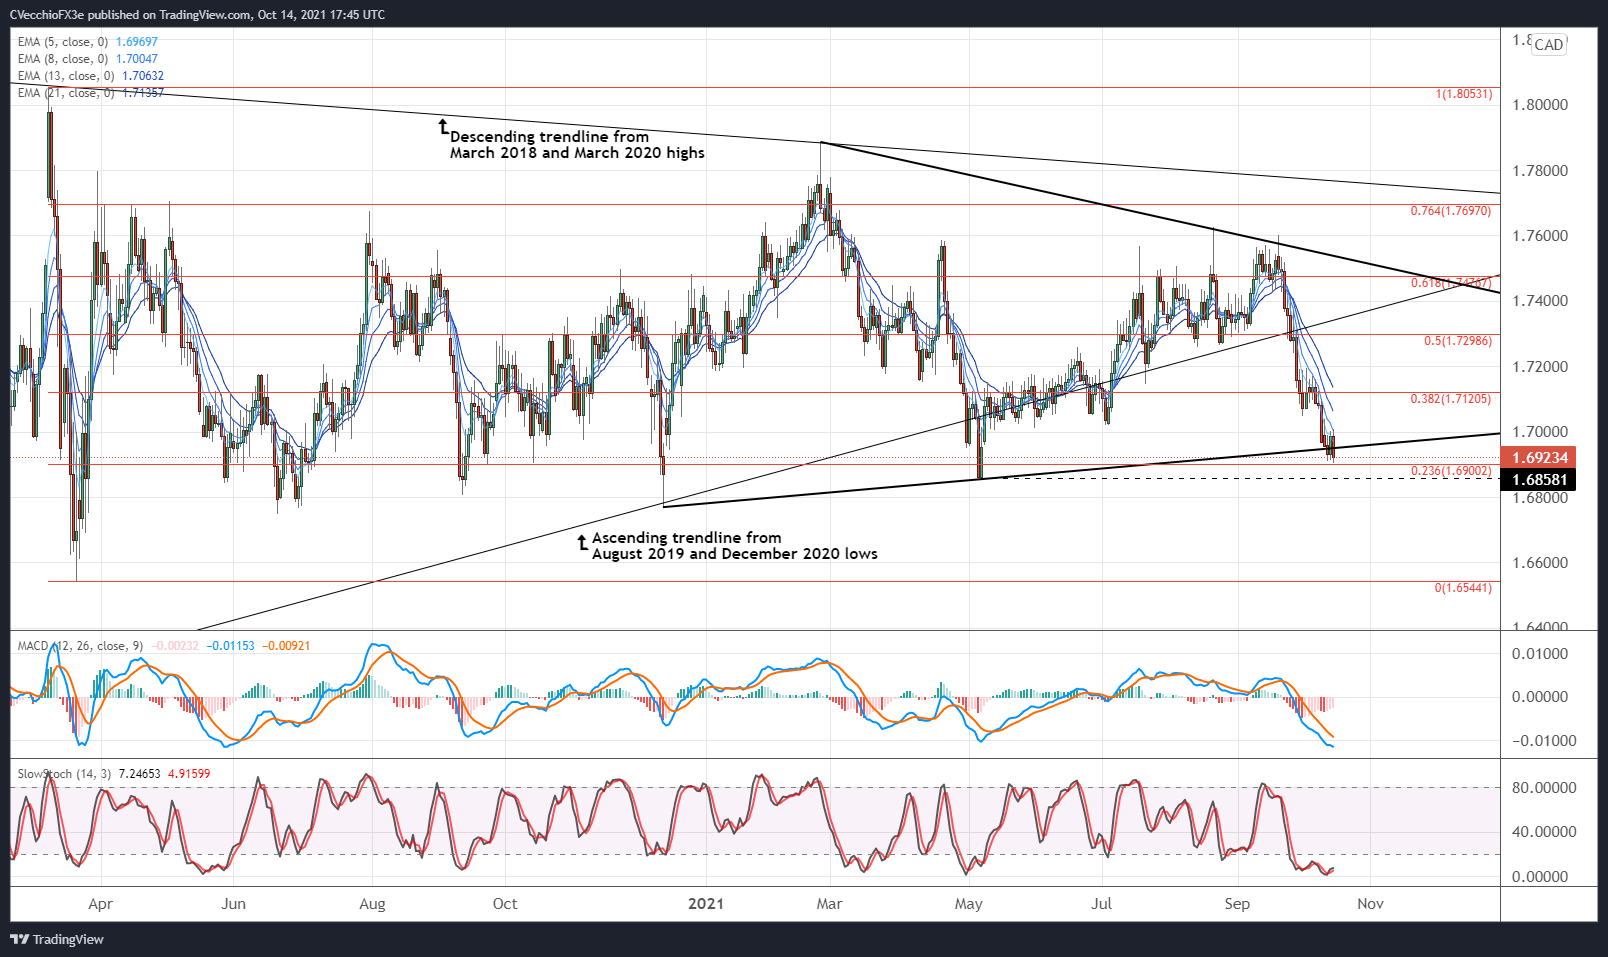
GBP/CAD rates may be in the early stages of a more meaningful breakdown. The pair has recently exit the symmetrical triangle in place since November 2020, after having exited the longer-term symmetrical triangle measured against the descending trendline from the March 2018 and March 2020 highs and the ascending trendline from the August 2019 and December 2020 lows.
The pair is below its daily EMA envelope, which is in bearish sequential order. Daily MACD continues to drop while below its signal line, and daily Slow Stochastics are holding in oversold territory. A return to the yearly low set at 1.6858 may be right around the corner, particularly if energy prices continue their march higher.
GBP/NZD RATE TECHNICAL ANALYSIS: DAILY CHART (FEBRUARY 2020 TO OCTOBER 2021) (CHART 3)
(Click on image to enlarge)

GBP/NZD rates have been in a symmetrical triangle since last August, but another test of trendline support from the December 2020 and September 2021 lows may soon arrive. A break of this uptrend would signal the start of a deeper pullback, one that could eye the 23.6% Fibonacci retracement of the 2020 high/2021 low range at 1.9287 as the first target.
Momentum is just starting to turn more bearish. GBP/NZD rates are below their daily EMA envelope, but the moving averages are not yet in bearish sequential order. Daily MACD is turning lower and is on the verge of dropping below its signal line, while daily Slow Stochastics are falling while still above their median line. The seeds are planted for a more considerable pullback through the end of October.


