Join Our Telegram channel to stay up to date on breaking news coverage
Litecoin Price Prediction – October 17
The Litecoin price may need to stay above the moving averages to prevent further downward movement.
LTC/USD Market
Key Levels:
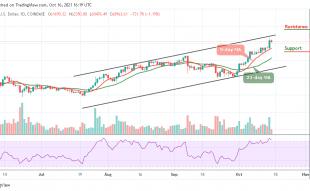
Resistance levels: $210, $220, $230
Support levels: $170, $160, $150

LTC/USD falls from $188 to $183 as the downward trending line acts as market resistance. At the time of writing, the price is currently heading towards the 9-day moving average as the $180 support line needs to be defended by the bulls to prevent further downward movement. However, the technical indicator Relative Strength Index (14) is likely to drop below 55-level, hinting that even further price drop may come to play.
Litecoin Price Prediction: Litecoin (LTC) May Drop More
However, the longer that the Litecoin price fails to rally from current trading levels, the greater the chance that we may see the cryptocurrency falling to a new trading low. A break below the $180 support level may provoke an even deeper decline towards the $170, $160, and $150 resistance levels.
Moreover, the daily chart highlights that LTC/USD at the $190 level, is a key technical region which bulls need to break and traders may need to see a sustainable move above this level to retest $192 level. The ultimate bulls’ goal is created towards the ascending channel at $210, $220, and $240 resistance levels.
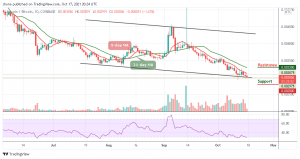
When compares with Bitcoin, the Litecoin price is seen moving downward below the 9-day and 21-day moving averages. The Litecoin (LTC) on the market cap is yet to define its bullish movement because the market movement has remained clouded by more red candles than green for the past few days.
However, as the technical indicator Relative Strength Index (14) nosedives to the oversold region, a bearish continuation may roll the market back to the support of 2900 SAT with a possible break below the lower boundary of the channel and further declines could be at 2800 SAT and below, which may establish a new low for the market. Meanwhile, any bullish movement above the 9-day moving average may hit the resistance level of 3300 SAT and above.
Looking to buy or trade Litecoin (LTC) now? Invest at eToro!
67% of retail investor accounts lose money when trading CFDs with this provider
Join Our Telegram channel to stay up to date on breaking news coverage