
Published
2 years ago on
October 19, 2021
ETHEREUM REMAINS A SLOWER MOVER THAN BITCOIN
Over the last 10 days, Ethereum (ETH/USDT) has continued its growth in value at a slower rate than Bitcoin (BTC/USDT) and currently is trading at $3764 as of Tuesday 19th October which represents a weekly change of +8.2% (compared to Bitcoin's +9.5%). The Ethereum to Bitcoin ratio (ETH/BTC) is at 0.061, the lowest reading since 30th July/1st August. The altcoin season isn't here just yet. Actually, the BTC/ETH chart at the moment points to farther potential for a move to the upside with many experts expecting the BTC Domination to reach as high as 50% before the trend reversal. We need to remember that today's Fear & Greed Index reading, that is flashing Greed (75/100, Monday's reading showed Extreme Greed at 78/100) must be more overheated for the largest cryptocurrency than it is for ETH and other altcoins due to the dynamics of the cryptomarkets in recent weeks.
Now let us have a proper look into some important pieces of on-chain data for both of the largest tokens (BTC: $1.177T and ETH: $450B in market cap) since that would hugely help us establish the probability of keeping up the ongoing 'Uptober' uptrend. As Bitcoin closed the weekly candle at the highest price in the history ($61.5-$62k yet the the current ATH price @ +$64.8k occured this past April, six months ago), its reserves on exchanges hit the lowest amount in a very long time. Long-term BTC investors have been steadily adding to their holdings over the recent months, although the rate at which they have putting more funds into BTC has been slowing down slightly this month, a very important indicator to watch. Same goes for Ethereum, still much more demand than supply. When can we expect the large wallet holders to start selling their coins?
Let's bear in mind just how much Bitcoin and ETH was accumulated during the Dip, mainly between $40-48k. The whales that bought at such prices would surely prefer to distribute much higher than $60-65k, but we also have to remember that when new ATH levels are recorded, most of the longer time-frame investors will be in profit so the probability of a deeper correction will be on a rise with each day that passes. As for the largest altcoin, as of today there are only 18 million ETH on exchanges compared to nearly 24 million ETH this past January. Only last week 400k ETH (ETH/USDT) were transferred out of one exchange, Coinbase, during a single day, Whoa. The Supply Shock is coming at the best possible time for those that are exposed to the cryptoasset. Another affirmative piece of on-chain data for the whole Ethereum blockchain said that the number of wallets holding a minimum of 1 ETH reached the ATH at 1.342 million. Nearly every other piece of on-chain stats for both BTC & ETH is suggesting a high likelihood of farther increase in valuations.
TECHNICAL ANALYSIS
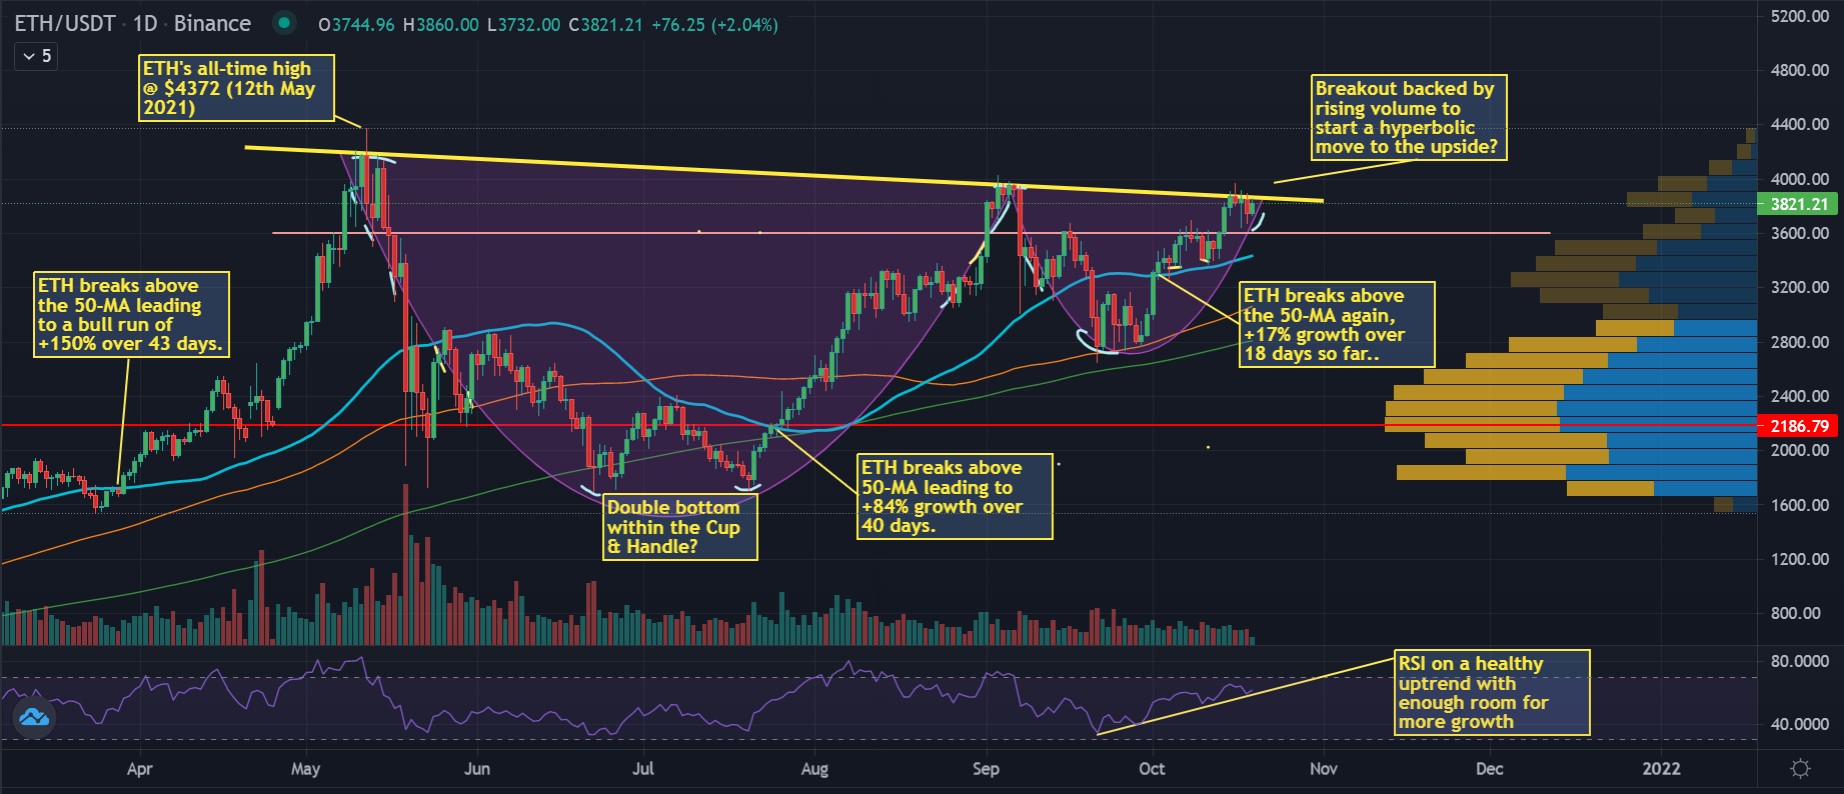
Ethereum's (ETH/USDT) price today seems to be on a brink of a bigger move having last week broken the $3600-$3650 level of traditional resistance which currently is our strongest level of support and that is a very decent achievement based on two crucial rejections from this level leading to deeper corrections each time. On a macro scale, once we zoom out and switch to the daily or even weekly, we immediately are able to notice a gigantic Cup & Handle, a pattern originating from ETH's ATH @$4372 back in May. The bottom of this formation has got touches as low as +$1700 with a potential double bottom within visible as well. If the pattern breaks then the possible target would be above the $8k mark. What's even more bullish is that the handle of our Cup & Handle formation now looks like another bullish formation: Inverse Head & Shoulders.
Ethereum in my opinion has been in a perfectly looking uptrend, especially since the beginning of October when it started the new month at around the $3k mark. On the 1st the price bounced off the 50-MA, pierced through the 100-MA immediately and also the 200-MA right on the very next day. See the chart I prepared to find out what the price did on previous ocassions when it crossed the 50-MA from below. So, the 50-MA got tested once more for a few days and for now ETH has been respecting this all-important moving average as nearest support coincidently slighly above the vital $3600 level. Going back to our Cup & Handle and Inverse Head & Shoulders, I fully expect these patterns to break to the upside in the coming weeks with the fundamentals looking spectacular and primed for more growth. The RSI on the daily is just above 60, so based on historical data we could be getting between 10-14 days of parabolic movement at some point.
Disclaimer: This trading analysis is provided by a third party, and for informational purposes only. It does not reflect the views of Crypto Daily, nor is it intended to be used as legal, tax, investment, or financial advice.
Dexalot Brings Its CEX-Like DEX Trading Platform To Ethereum L2 Arbitrum
EY Debuts Ethereum-Powered Blockchain Solution for Streamlining Complex Contracts