- The GBP/JPY continue its rally for the third consecutive week, trades at five-month highs.
- Positive market sentiment weighs on the Japanese yen, boosts the British pound.
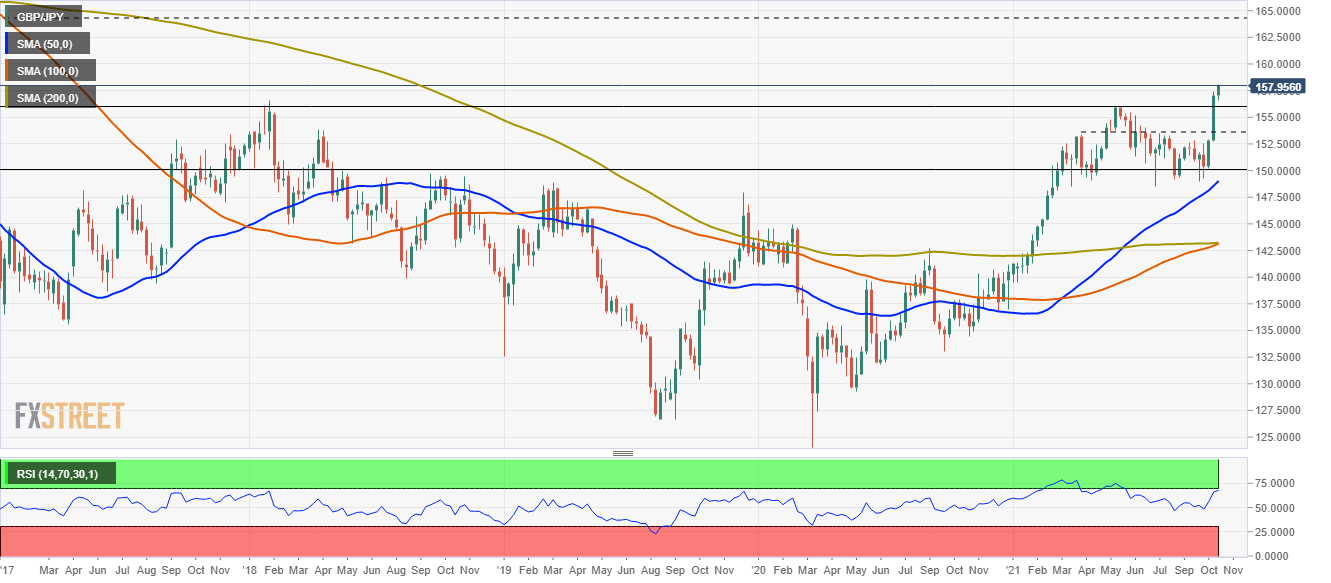
- GBP/JPY: The weekly chart depicts the possibility of a break of a trading range, opening the door for higher prices.
The GBP/JPY edges higher as the Asian session begins, up 0.13%, trading at 157.88 at the time of writing. Positive market sentiment surrounds the financial markets, depicted by Asian equity futures rising between 0.67% and 2.17%, except for the Nikkei 225 falling 0.04%. Furthermore, risk-sensitive currencies like the British pound, the Australian, and the New Zealand dollar, rallied against the safe-haven status Japanese yen.
GBP/JPY Price Forecast: Technical outlook
The weekly chart depicts the GBP/JPY is breaking to the upside, leaving February 2018 resistance level around 156.61 as its first support. A weekly close over the abovementioned could open the way towards the March 2016 swing highs around 163.90. A breach of the latter would open a test of the February 2015 highs around 175.02.
On the flip side, failure at 156.61 could open the way for further losses. The first support level would be psychological 156.00. A break below that level would exert downward pressure on the pair, exposing vital support levels, as the September swing highs around 153.42, followed by the 150.00 psychological level.
The Relative Strength Indes (RSI) is at 67, indicating that upward pressure remains in place. However, as it is closer to overbought conditions, the GBP/JPY pair could print a correction before resuming the upward trend.
Information on these pages contains forward-looking statements that involve risks and uncertainties. Markets and instruments profiled on this page are for informational purposes only and should not in any way come across as a recommendation to buy or sell in these assets. You should do your own thorough research before making any investment decisions. FXStreet does not in any way guarantee that this information is free from mistakes, errors, or material misstatements. It also does not guarantee that this information is of a timely nature. Investing in Open Markets involves a great deal of risk, including the loss of all or a portion of your investment, as well as emotional distress. All risks, losses and costs associated with investing, including total loss of principal, are your responsibility. The views and opinions expressed in this article are those of the authors and do not necessarily reflect the official policy or position of FXStreet nor its advertisers. The author will not be held responsible for information that is found at the end of links posted on this page.
If not otherwise explicitly mentioned in the body of the article, at the time of writing, the author has no position in any stock mentioned in this article and no business relationship with any company mentioned. The author has not received compensation for writing this article, other than from FXStreet.
FXStreet and the author do not provide personalized recommendations. The author makes no representations as to the accuracy, completeness, or suitability of this information. FXStreet and the author will not be liable for any errors, omissions or any losses, injuries or damages arising from this information and its display or use. Errors and omissions excepted.
The author and FXStreet are not registered investment advisors and nothing in this article is intended to be investment advice.
Recommended content
Editors’ Picks
AUD/USD posts gain, yet dive below 0.6500 amid Aussie CPI, ahead of US GDP

The Aussie Dollar finished Wednesday’s session with decent gains of 0.15% against the US Dollar, yet it retreated from weekly highs of 0.6529, which it hit after a hotter-than-expected inflation report. As the Asian session begins, the AUD/USD trades around 0.6495.
USD/JPY finds its highest bids since 1990, approaches 156.00

USD/JPY broke into its highest chart territory since June of 1990 on Wednesday, peaking near 155.40 for the first time in 34 years as the Japanese Yen continues to tumble across the broad FX market.
Gold stays firm amid higher US yields as traders await US GDP data

Gold recovers from recent losses, buoyed by market interest despite a stronger US Dollar and higher US Treasury yields. De-escalation of Middle East tensions contributed to increased market stability, denting the appetite for Gold buying.
Ethereum suffers slight pullback, Hong Kong spot ETH ETFs to begin trading on April 30

Ethereum suffered a brief decline on Wednesday afternoon despite increased accumulation from whales. This follows Ethereum restaking protocol Renzo restaked ETH crashing from its 1:1 peg with ETH and increased activities surrounding spot Ethereum ETFs.
Dow Jones Industrial Average hesitates on Wednesday as markets wait for key US data

The DJIA stumbled on Wednesday, falling from recent highs near 38,550.00 as investors ease off of Tuesday’s risk appetite. The index recovered as US data continues to vex financial markets that remain overwhelmingly focused on rate cuts from the US Fed.