- Positive market sentiment favors risk-sensitive currencies, like the AUD.
- AUD/JPY: The prevailing trend still tilted to the upside on the back of the interest rate differentials.
- AUD/JPY: Closes to 86.00, on the back of a risk-on environment.
The AUD/JPY advances as the Asian session begins, barely up 0.02%, trading at 85.93 at the time of writing. The market sentiment is upbeat, as the Asian sessions follow through the New York footsteps, with Asian equity futures rising between 0.02% and 1.45%, except for the Japanese Topix, which drops 0.25% at press time.
The positive market sentiment has gained follow-through since Monday. Robust third-quarter US corporate earnings remain the main driver of the financial markets, as companies have printed numbers better than expected, despite the ongoing elevated energy costs and rising raw materials around the globe.
AUD/JPY Price Forecast: Technical outlook
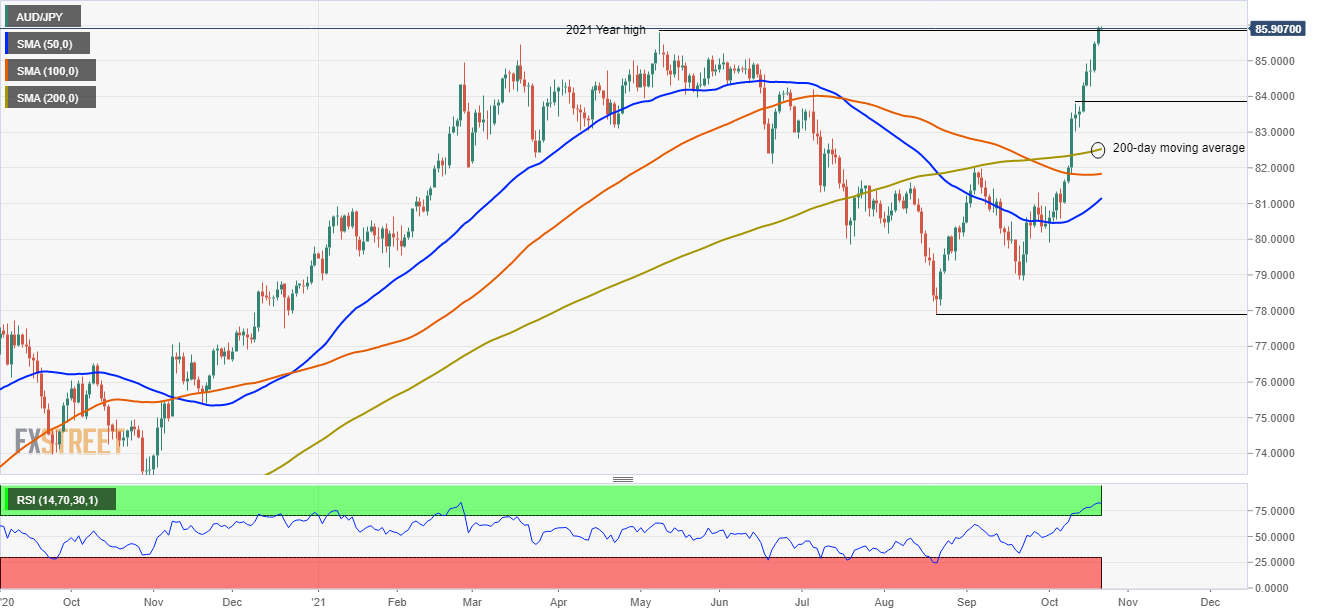
Daily chart
The AUD/JPY is trading at fresh five-month highs, trading above the May 10 high of 85.80, on the doors of 86.00. In the case of a daily close above the latter, December 5, 2017, high at 86.84 would be the first resistance. A sustained break of that level would expose crucial supply areas towards an 89.00 challenge. Firstly January 10, 2018, low at 87.20, followed by January 31, 2018, high at 88.49.
On the other hand, failure at 86.00 could send the AUD/JPY tumbling lower. A daily close below the 84.27 level could spur a downward move towards 83.80. A breach of the latter would expose the 200-day moving average (DMA) at 82.47.
The Relative Strength Index (RSI), a momentum indicator, is at 82, in overbought levels, indicating that the AUD/JPY might consolidate. That outcome could open the door to a “buy the dip” narrative, as the upward bias is confirmed by the daily moving averages (DMA’s), which are located well below the spot price.
Information on these pages contains forward-looking statements that involve risks and uncertainties. Markets and instruments profiled on this page are for informational purposes only and should not in any way come across as a recommendation to buy or sell in these assets. You should do your own thorough research before making any investment decisions. FXStreet does not in any way guarantee that this information is free from mistakes, errors, or material misstatements. It also does not guarantee that this information is of a timely nature. Investing in Open Markets involves a great deal of risk, including the loss of all or a portion of your investment, as well as emotional distress. All risks, losses and costs associated with investing, including total loss of principal, are your responsibility. The views and opinions expressed in this article are those of the authors and do not necessarily reflect the official policy or position of FXStreet nor its advertisers. The author will not be held responsible for information that is found at the end of links posted on this page.
If not otherwise explicitly mentioned in the body of the article, at the time of writing, the author has no position in any stock mentioned in this article and no business relationship with any company mentioned. The author has not received compensation for writing this article, other than from FXStreet.
FXStreet and the author do not provide personalized recommendations. The author makes no representations as to the accuracy, completeness, or suitability of this information. FXStreet and the author will not be liable for any errors, omissions or any losses, injuries or damages arising from this information and its display or use. Errors and omissions excepted.
The author and FXStreet are not registered investment advisors and nothing in this article is intended to be investment advice.
Recommended content
Editors’ Picks
EUR/USD turns negative near 1.0760

The sudden bout of strength in the Greenback sponsored the resurgence of the selling pressure in the risk complex, dragging EUR/USD to the area of daily lows near 1.0760.
GBP/USD comes under pressure and challenges 1.2500

GBP/USD now rapidly loses momentum and gives away initial gains, returning to the 1.2500 region on the back of the strong comeback of the US Dollar.
Gold retreats from highs on stronger Dollar, yields

XAU/USD trims part of its initial advance in response to the jump in the Dollar's buying interest and the re-emergence of the upside pressure in US yields.
XRP tests support at $0.50 as Ripple joins alliance to work on blockchain recovery

XRP trades around $0.5174 early on Friday, wiping out gains from earlier in the week, as Ripple announced it has joined an alliance to support digital asset recovery alongside Hedera and the Algorand Foundation.
Week ahead – US inflation numbers to shake Fed rate cut bets

Fed rate-cut speculators rest hopes on US inflation data. After dovish BoE, pound traders turn to UK job numbers. Will a strong labor market convince the RBA to hike? More Chinese data on tap amid signs of slow Q2 start.