- AUD/NZD M-formation on the daily chart is compelling.
- Wycoff Methodology is playing out on the 1-hour chart.
As per the prior analysis, ''AUD/NZD Price Analysis: Bulls waiting to pounce'', the price is representing much of the Wycoff accumulation theory in the recent consolidation of the bear trend on the daily chart.
The daily chart is compelling given the harmonic M-formation. This is a reversion pattern as follows:
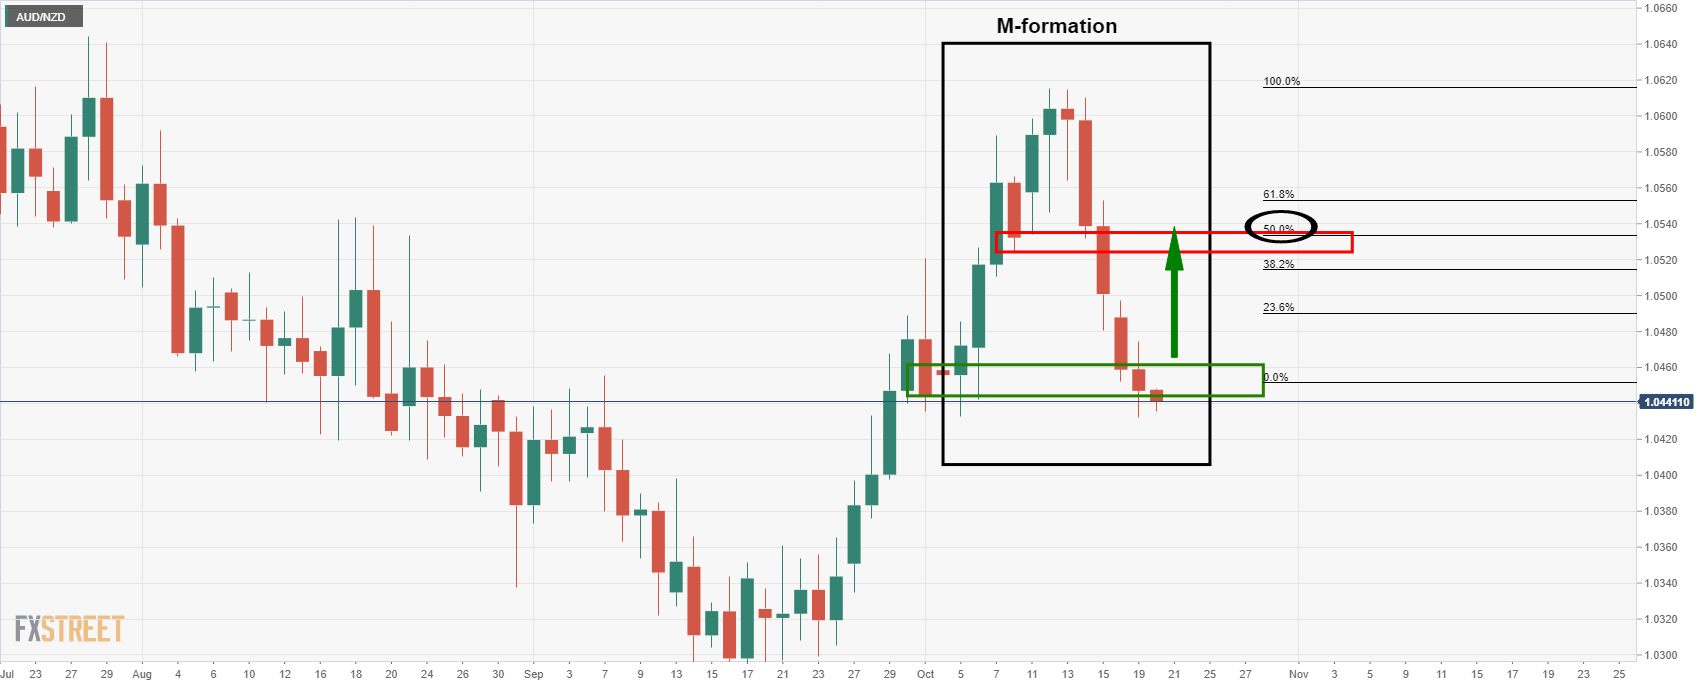
This chart was from the prior day's analysis where it was explained that ''the pattern that would be expected to draw in the price for a test of the formation's neckline. In this case, that level is the 8 Oct low at 1.0524.''
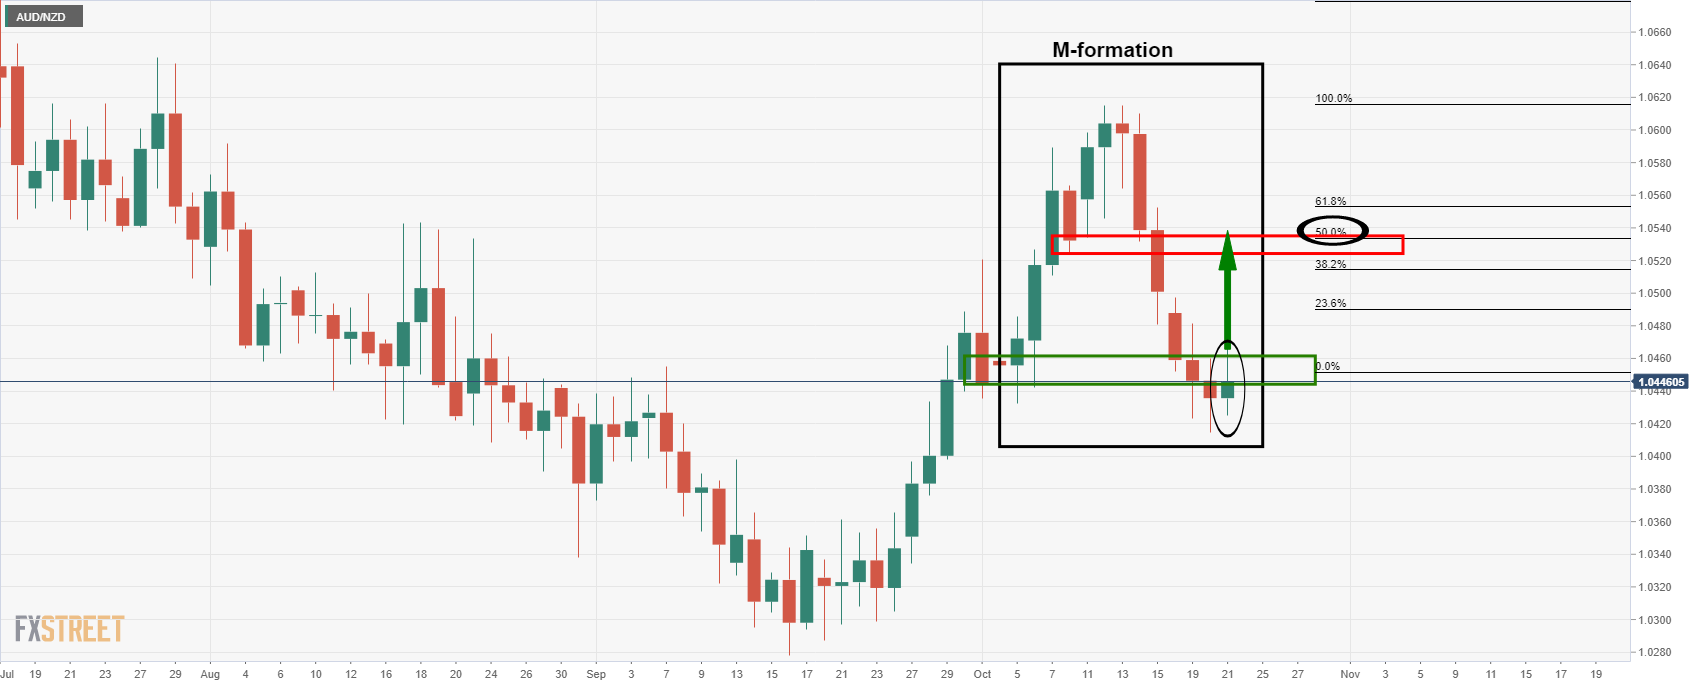
Since that analysis, we have seen the price start to correct, as expected:
Meanwhile, traders can approach the reversion from an hourly perspective and taking into consideration the Wycoff method can help traders keep out of bull and bear traps throughout the prolonged accumulation phase. This phase of accumulation is renowned for its whipsaw price action as demand outstrips supply in a battle between the bears and bulls, aka, the barroom brawl. In applying the thesis, it can assist traders to be patient and wait for signals that supply is exhausted before committing to the market long.
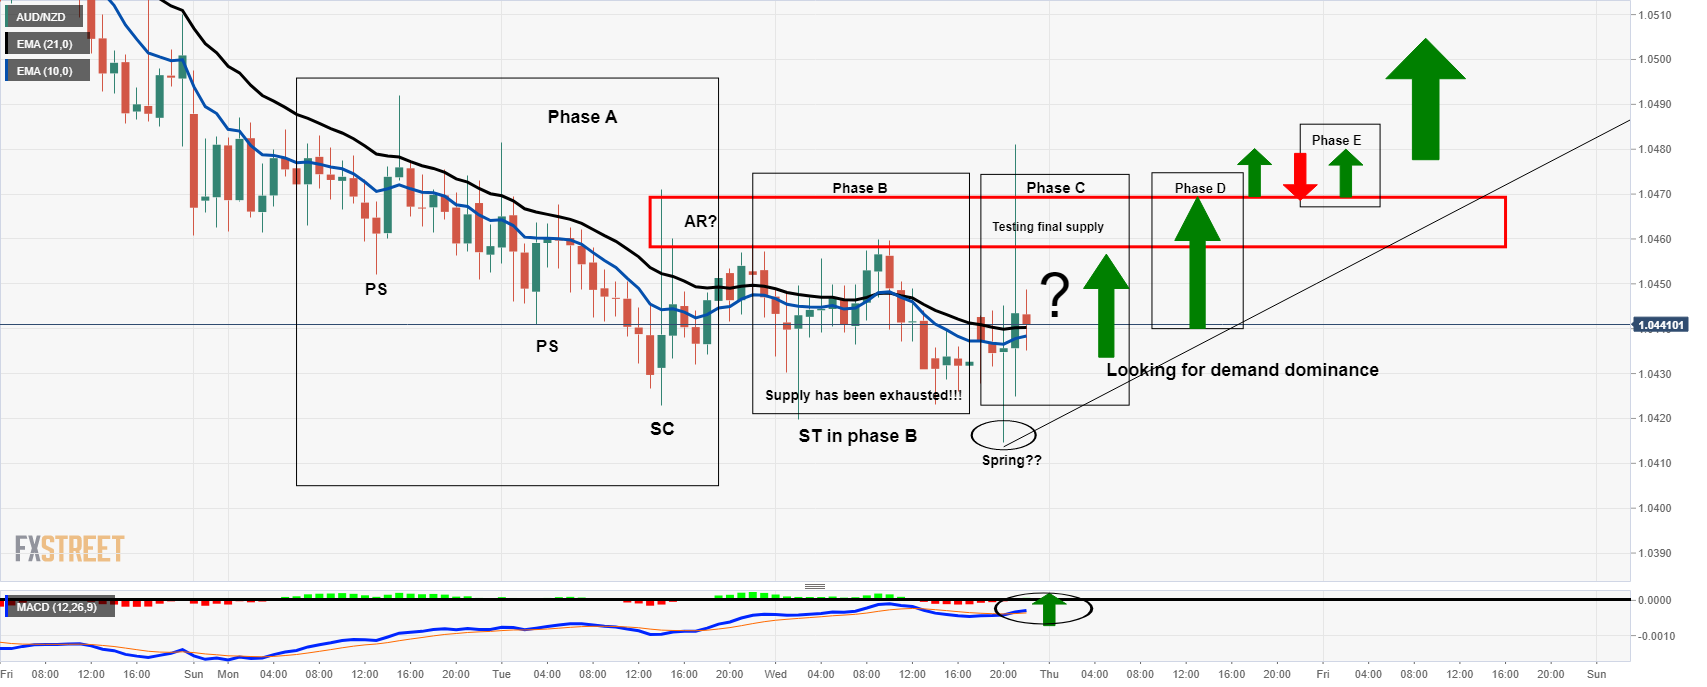
Wycoff 1HR chart
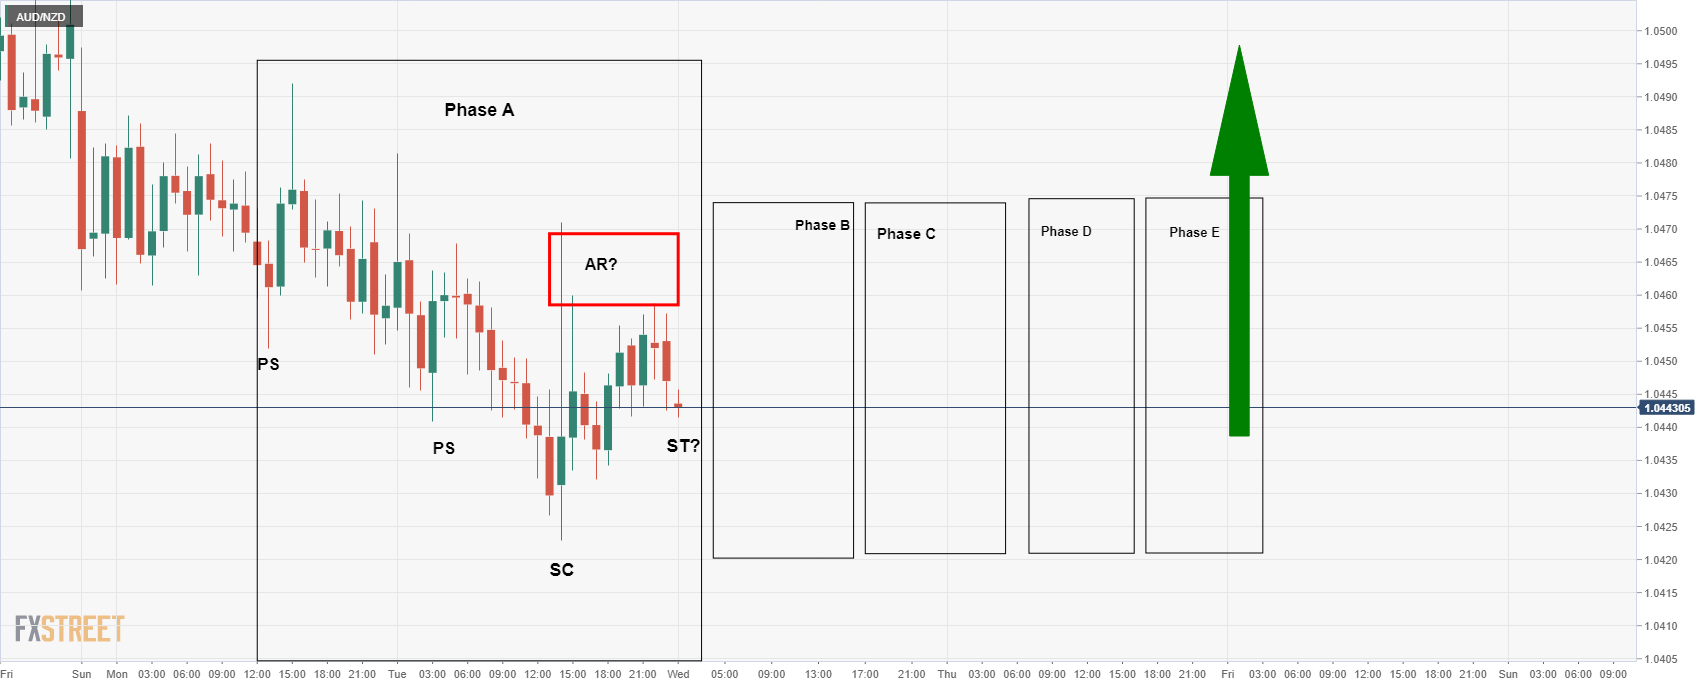
In the above analysis from yesterday, it was illustrated that Phase A was playing out. This was intended to help traders to stay patient and wait for the accumulation to play out through stages as follows:
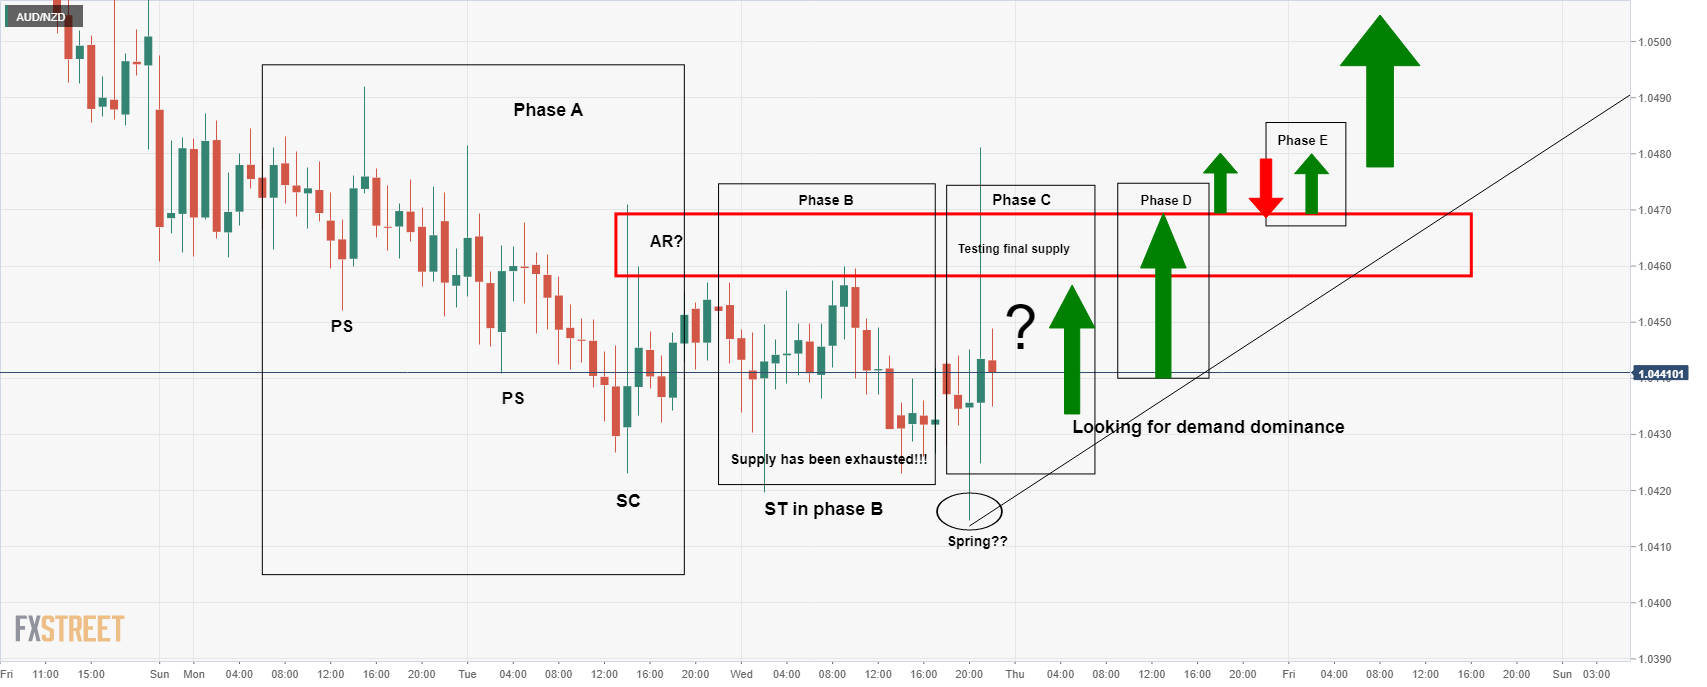
In this updated version in today's live market analysis, we can see how well this theory is playing out. At this juncture, traders can expect demand to dominate while investors buy up the cross one chunk at a time as sellers move to the sidelines and exit their long positions, propelling the price even higher towards the resistance.
How to know when accumulation is going to lead to a breakout?
Traders can read both the price action, looking for higher lows and higher highs, as well as useful indicators. One way to identify bullish territory is to apply MACD and a moving average crossover as follows:
When MACD, blue line, crosses above the zero line, black horizontal, then this is regarded as indicating that buyers indeed have control and that the environment is turning bullish. When applying a moving average crossover, such as the 10 moving up through the 21 EMA, this is a powerful combination to help identify buying conditions. At such a point that this occurs, bulls can look to engage, depending on price action and market structure, and target towards the daily M-formation's neckline.
Traders will look to price action for engulfing candles and/or momentum candles that are breaking short-term resistances. Once the resistance is broken, a classic way to engage is to wait for a pullback to restest the old resistance that would be expected to act as support and lead to a bull rally.
Information on these pages contains forward-looking statements that involve risks and uncertainties. Markets and instruments profiled on this page are for informational purposes only and should not in any way come across as a recommendation to buy or sell in these assets. You should do your own thorough research before making any investment decisions. FXStreet does not in any way guarantee that this information is free from mistakes, errors, or material misstatements. It also does not guarantee that this information is of a timely nature. Investing in Open Markets involves a great deal of risk, including the loss of all or a portion of your investment, as well as emotional distress. All risks, losses and costs associated with investing, including total loss of principal, are your responsibility. The views and opinions expressed in this article are those of the authors and do not necessarily reflect the official policy or position of FXStreet nor its advertisers. The author will not be held responsible for information that is found at the end of links posted on this page.
If not otherwise explicitly mentioned in the body of the article, at the time of writing, the author has no position in any stock mentioned in this article and no business relationship with any company mentioned. The author has not received compensation for writing this article, other than from FXStreet.
FXStreet and the author do not provide personalized recommendations. The author makes no representations as to the accuracy, completeness, or suitability of this information. FXStreet and the author will not be liable for any errors, omissions or any losses, injuries or damages arising from this information and its display or use. Errors and omissions excepted.
The author and FXStreet are not registered investment advisors and nothing in this article is intended to be investment advice.
Recommended content
Editors’ Picks
EUR/USD edges lower toward 1.0700 post-US PCE

EUR/USD stays under modest bearish pressure but manages to hold above 1.0700 in the American session on Friday. The US Dollar (USD) gathers strength against its rivals after the stronger-than-forecast PCE inflation data, not allowing the pair to gain traction.
GBP/USD retreats to 1.2500 on renewed USD strength

GBP/USD lost its traction and turned negative on the day near 1.2500. Following the stronger-than-expected PCE inflation readings from the US, the USD stays resilient and makes it difficult for the pair to gather recovery momentum.
Gold struggles to hold above $2,350 following US inflation

Gold turned south and declined toward $2,340, erasing a large portion of its daily gains, as the USD benefited from PCE inflation data. The benchmark 10-year US yield, however, stays in negative territory and helps XAU/USD limit its losses.
Bitcoin Weekly Forecast: BTC’s next breakout could propel it to $80,000 Premium

Bitcoin’s recent price consolidation could be nearing its end as technical indicators and on-chain metrics suggest a potential upward breakout. However, this move would not be straightforward and could punish impatient investors.
Week ahead – Hawkish risk as Fed and NFP on tap, Eurozone data eyed too

Fed meets on Wednesday as US inflation stays elevated. Will Friday’s jobs report bring relief or more angst for the markets? Eurozone flash GDP and CPI numbers in focus for the Euro.