
Advertisement
Advertisement
Bitcoin Analysis – When is the Next Bull Run
By:
Bitcoin set a new All-time-high on October 20, 2021 reaching $67K per BTC right before the futures settlement on October 21.

In this article:
Valkyrie Bitcoin ETF launch seems to have no effect on Bitcoin’s surge as many Bitcoin enthusiasts were expecting. The same day Bitcoin hit the new ATH, the first cryptocurrency also hit a new milestone, it reached a $1.26 trln market cap.
CME Bitcoin futures is currently showing a growth up to December, Bitcoin’s November futures are up 0.02%, whilst the December futures are up 0.19%. This might indicate that Bitcoin is expected to continue the climb up to December and possibly reach the $72K mark.
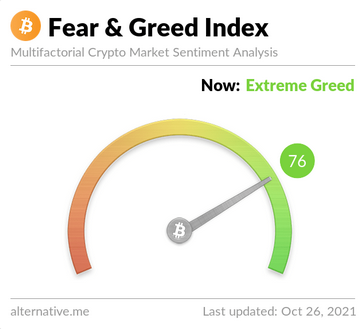
One of the indicators many Bitcoin traders watch is the Fear and Greed index. The indicator is currently at Extreme Greed, which might push sellers to push the BTC price down.
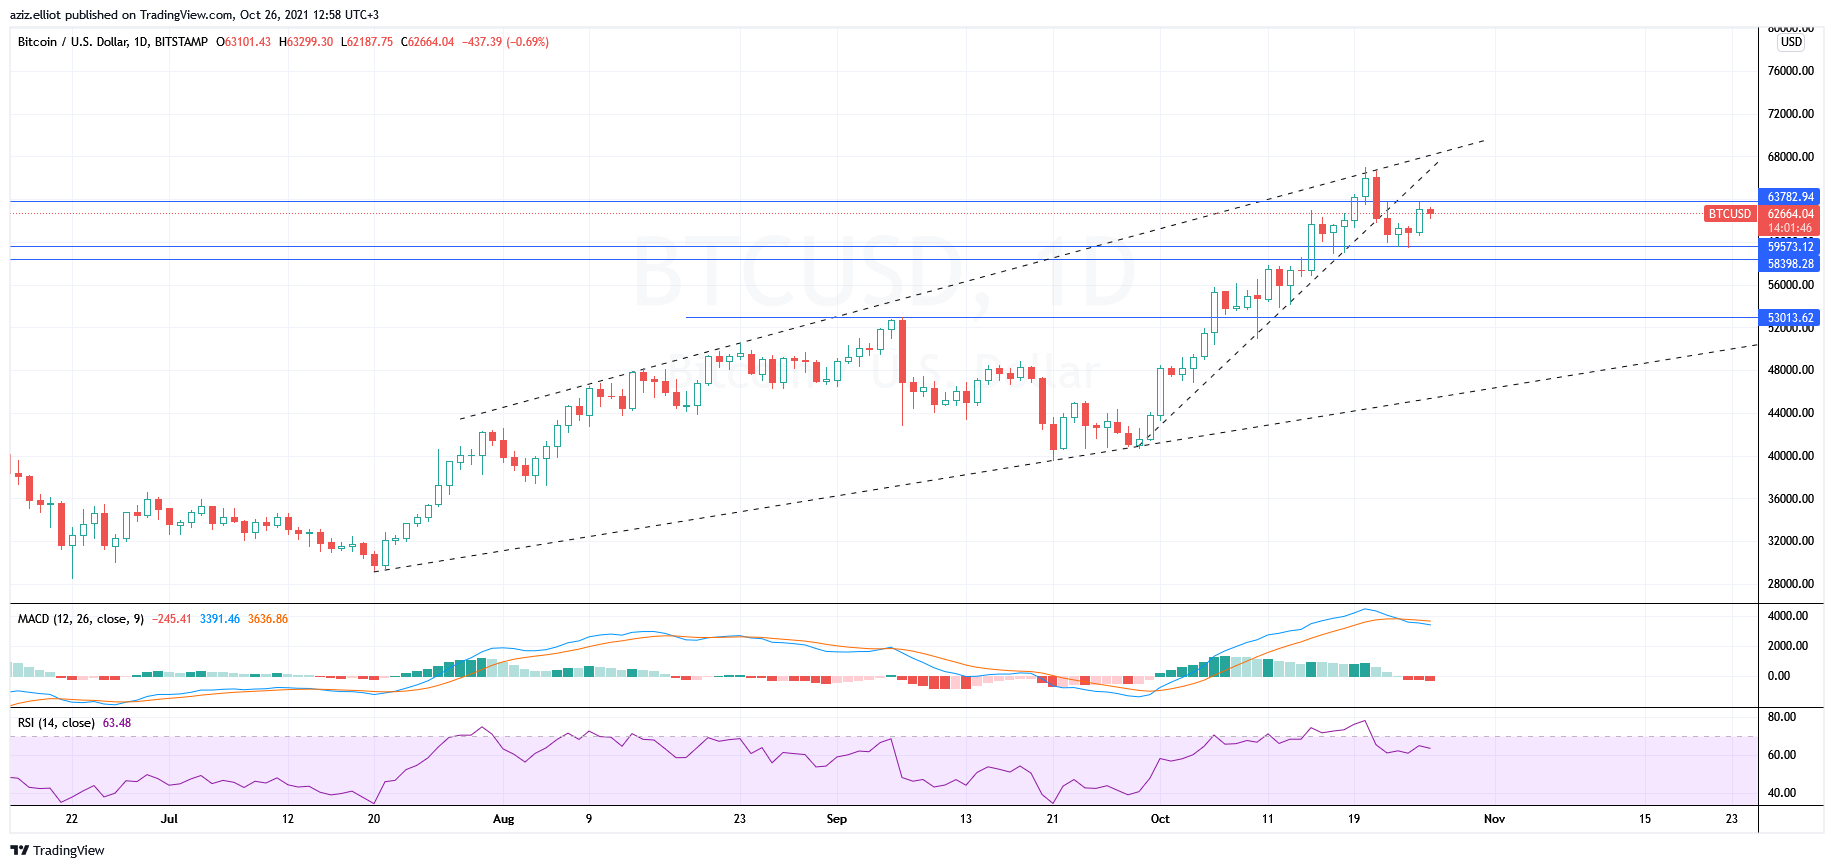
Bitcoin is back to tracking the US Dollar index, week started with a retest of October 22 high which resisted the uptrend continuation. BTCUSD since then has been waiting for the release of the US economic data, CB Consumer price confidence and the New home sales which are coming out later today. The released data will be moving the price.
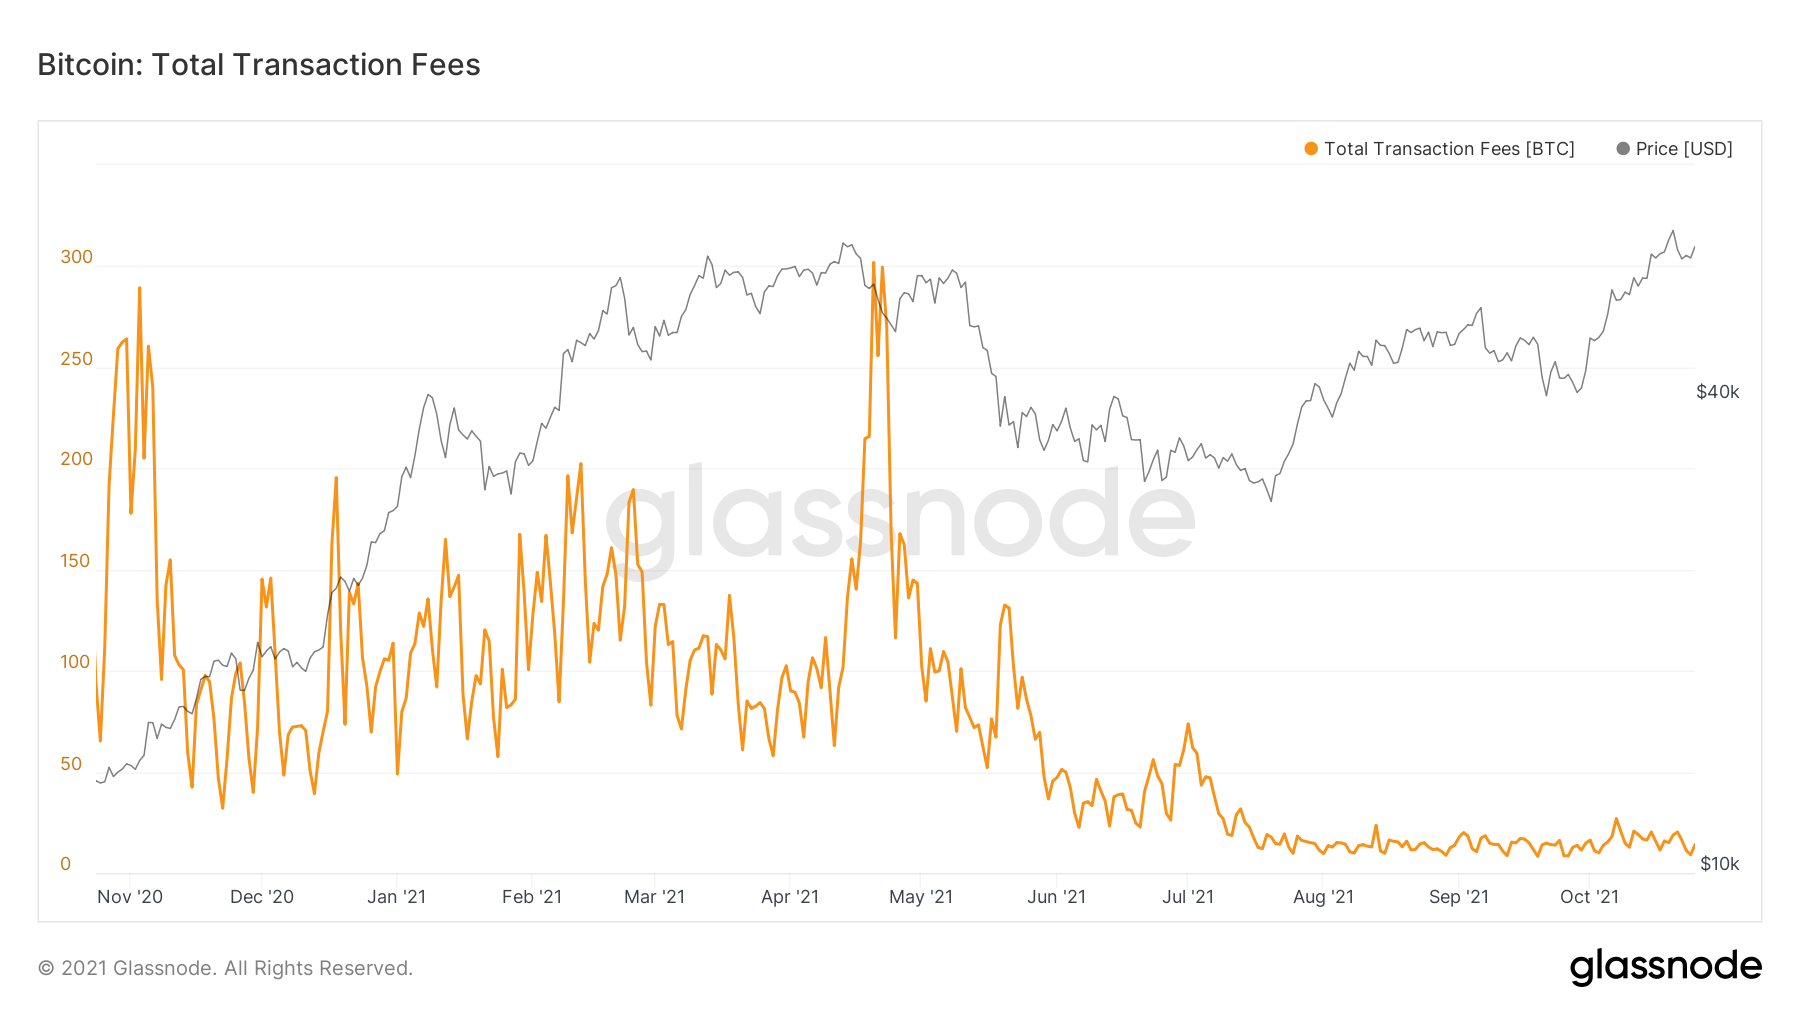
On-chain Bitcoin data, chiefly the Bitcoin fee, is a very healthy median for Bitcoin. On the ground that Bitcoin is being used as a legal tender in El Salvador and many countries willing to adopt Bitcoin as a legal tender, low transaction fees are crucial.
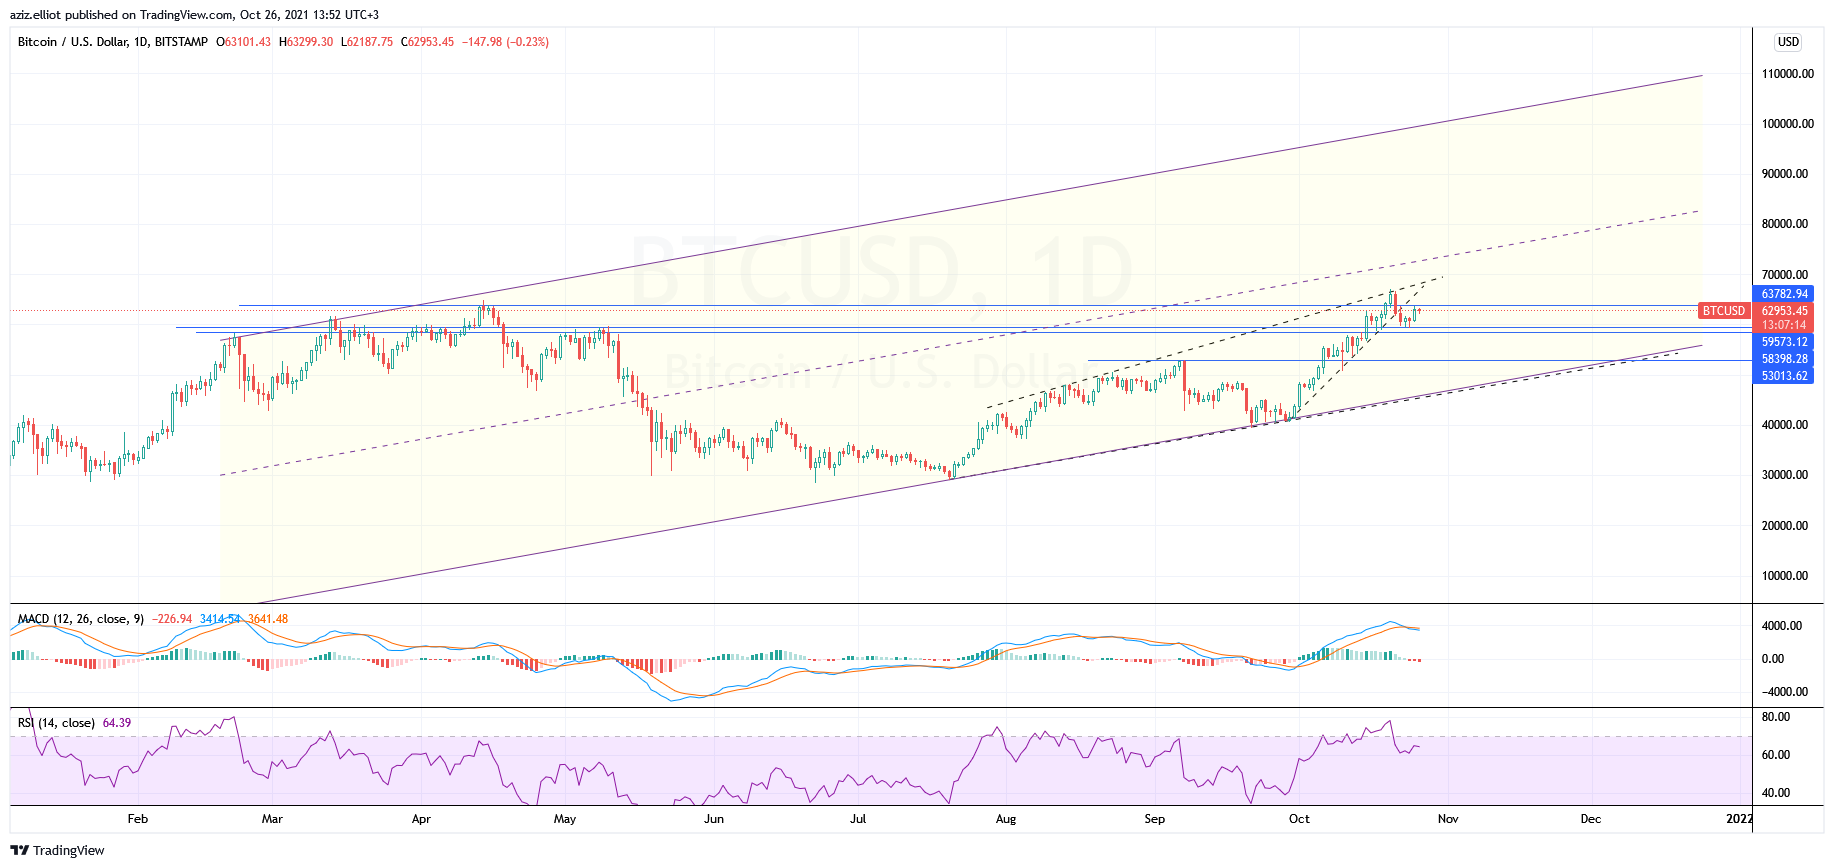
On the other hand, the daily Bitcoin chart signals a correction ahead. Mainly the correction began when Bitcoin reached its dynamic resistance of August 9. MACD and RSI indicators on a daily chart are bearish, Bitcoin closed below the support of the uptrend channel and might correct down to $53100 if it doesn’t close above $63800.
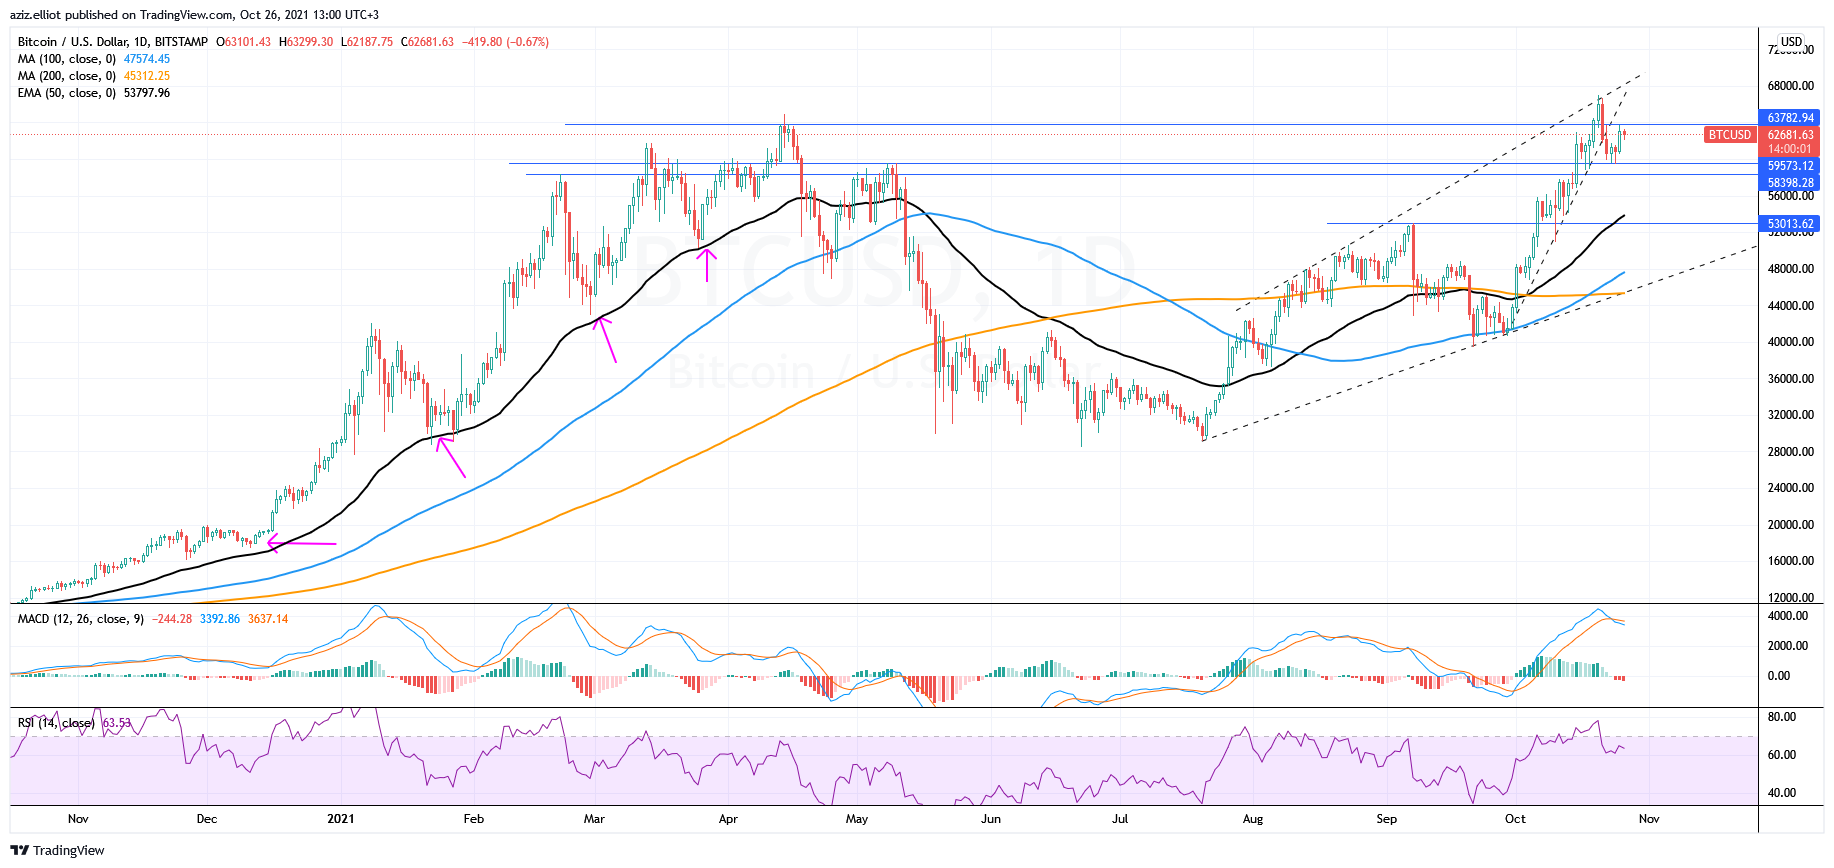
Since its massive 2021 uptrend Bitcoin’s price was testing EMA50 as support.
Hence, if BTCUSD doesn’t close above $63800-$64100 and there is no significant bull power, bears might take control of the price and push the price lower, to retest EMA50. Supports to watch are $55300, $53100 and $53000.
Whenever you see any analyst claim that Bitcoin price could hit $110K, don’t be pessimistic, refer to this uptrend parallel channel. For the longer term, Bitcoin is very likely to hit this mark by December 2021, if BTC is backed by a high uptrend impulse.
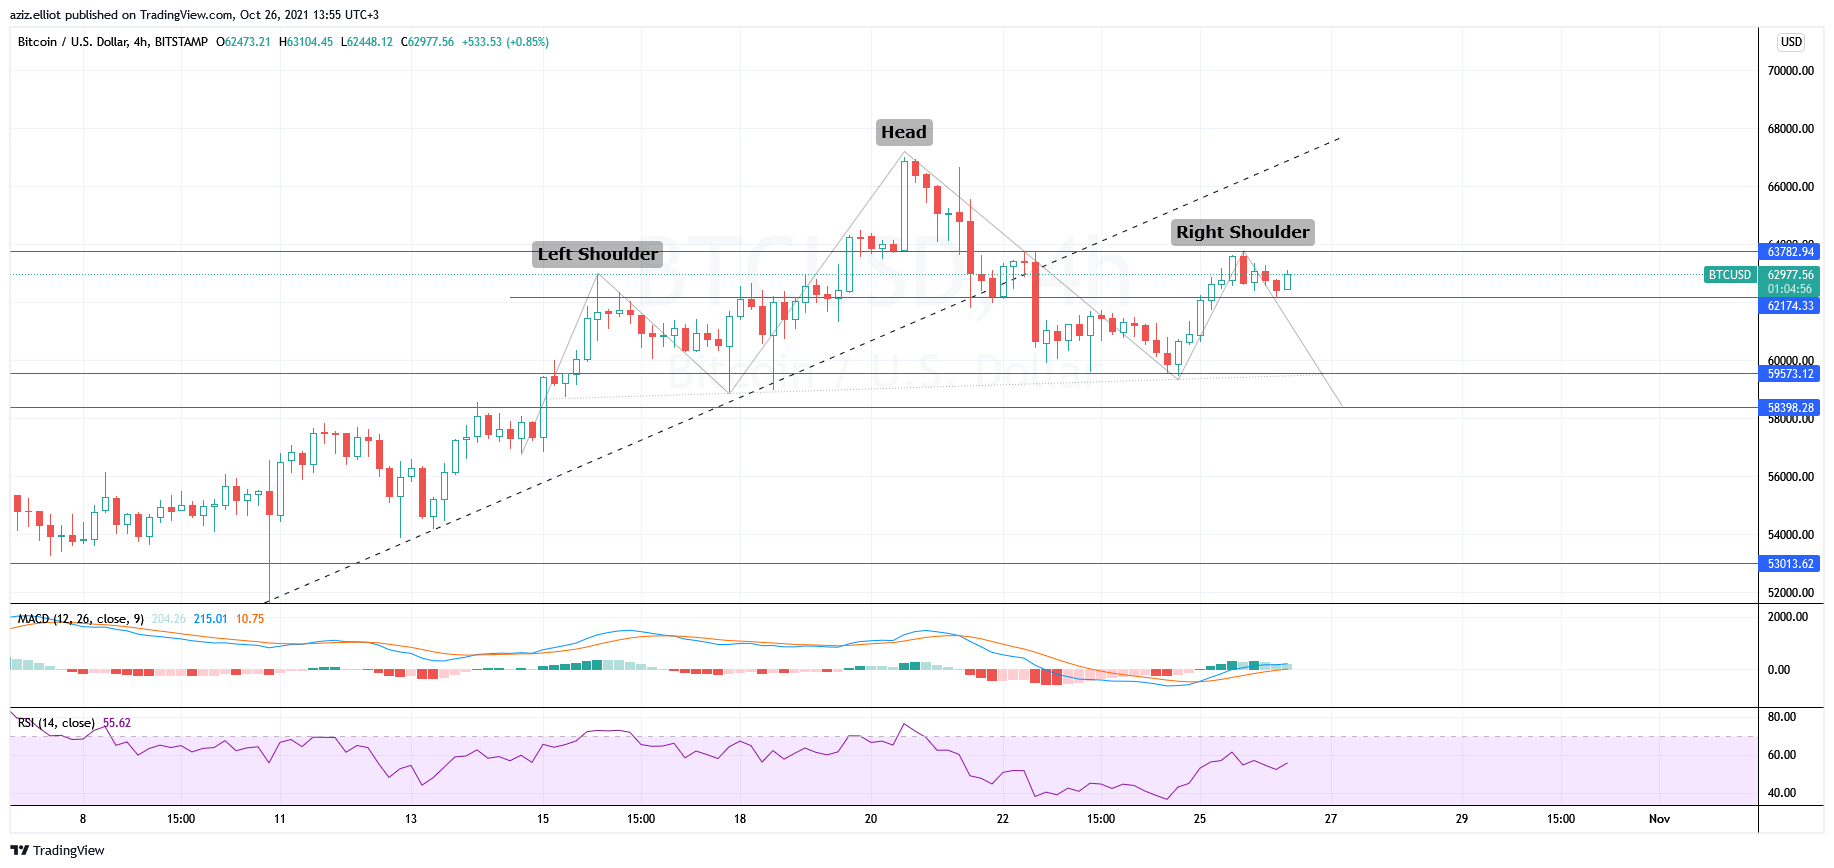
4-Hour BTCUSD has a Head and Shoulders pattern being formed. This pattern also suggests that Bitcoin might show correction if it stays below $63800 and $64100 which is a Fibo 0.618 of the October 21 drop.
To sum up, Bitcoin is still one of the most promising assets to invest in, its growing scarcity and the migration of miners to the US show a solid confidence in its continuous growth. Decreasing fees on Bitcoin’s network and its popularity assists in the adoption of Bitcoin globally. Robinhood, for instance is adding its own crypto-wallet and already has 1 mln subscribers, hence I highly recommend to keep an eye on BTC.
About the Author
Aziz Kenjaevcontributor
Technical analyst, crypto-enthusiast, ex-VP at TradingView, medium and long-term trader, trades and analyses FX, Crypto and Commodities markets.
Did you find this article useful?
Latest news and analysis


Advertisement